JE23: Benchmarking a finite-volume scheme for 3D Euler equations
In this note, I simulate a number of benchmark problems for the 3D Euler equations. The scheme is a finite-volume wave-propagation algorithm. Dimensional splitting is used. I.e. the scheme can be written as
I.e. the X-direction update is performed first, then the Y-direction update, and finally the Z-direction update. See JE22 for other details about the scheme, and for 2D benchmarks.
These problems are taken from a paper by Langseth and LeVeque [Langseth2000], which describes the unsplit wave-propagation algorithm for the solution of 3D Euler equations. None of the problems tested has an exact solution, so mostly eye-ball metric is used to quantify the results.
Spherical Riemann Problem
In this problem a gas, initially at rest, fills the space between two walls at \(z=0\) and \(z=1\). The density and pressure are \(\rho_0=1.0\) and \(p_0=1.0\), except inside a sphere centered at \((0,0,0.4)\) with radius \(0.2\). Inside the sphere the pressure is higher, \(p_i=5.0\). This results in a strong outward moving shock wave, a contact discontinuity and an inward moving rarefaction. This rarefaction causes an “implosion”, creating a second outward moving shock wave. Note that this problem has cylindrical symmetry about the Z-axis. Hence, a special version of Gkeyll, setup to solve axisymmetric Euler equations (see last section of this note) is used to verify the 3D results obtained.
The simulations are performed on a quarter of the domain \((x,y,z)\in [0,1.5]\times [0,1.5]\times [0,1.0]\). Symmetry is assumed on the \(x=0\) and \(y=0\) planes. Other boundaries are open (note that there are walls at \(z=0\) and \(z=1\)). The simulation is performed on a \(37\times 37\times 25\), \(75\times 75\times 50\) and \(150\times 150\times 300\) grid. For comparison, the solution from the axisymmetric solver on a \(600\times 400\) grid is used as a reference. The figure below shows the results, which compare well with those published in [Langseth2000], Figure 6.
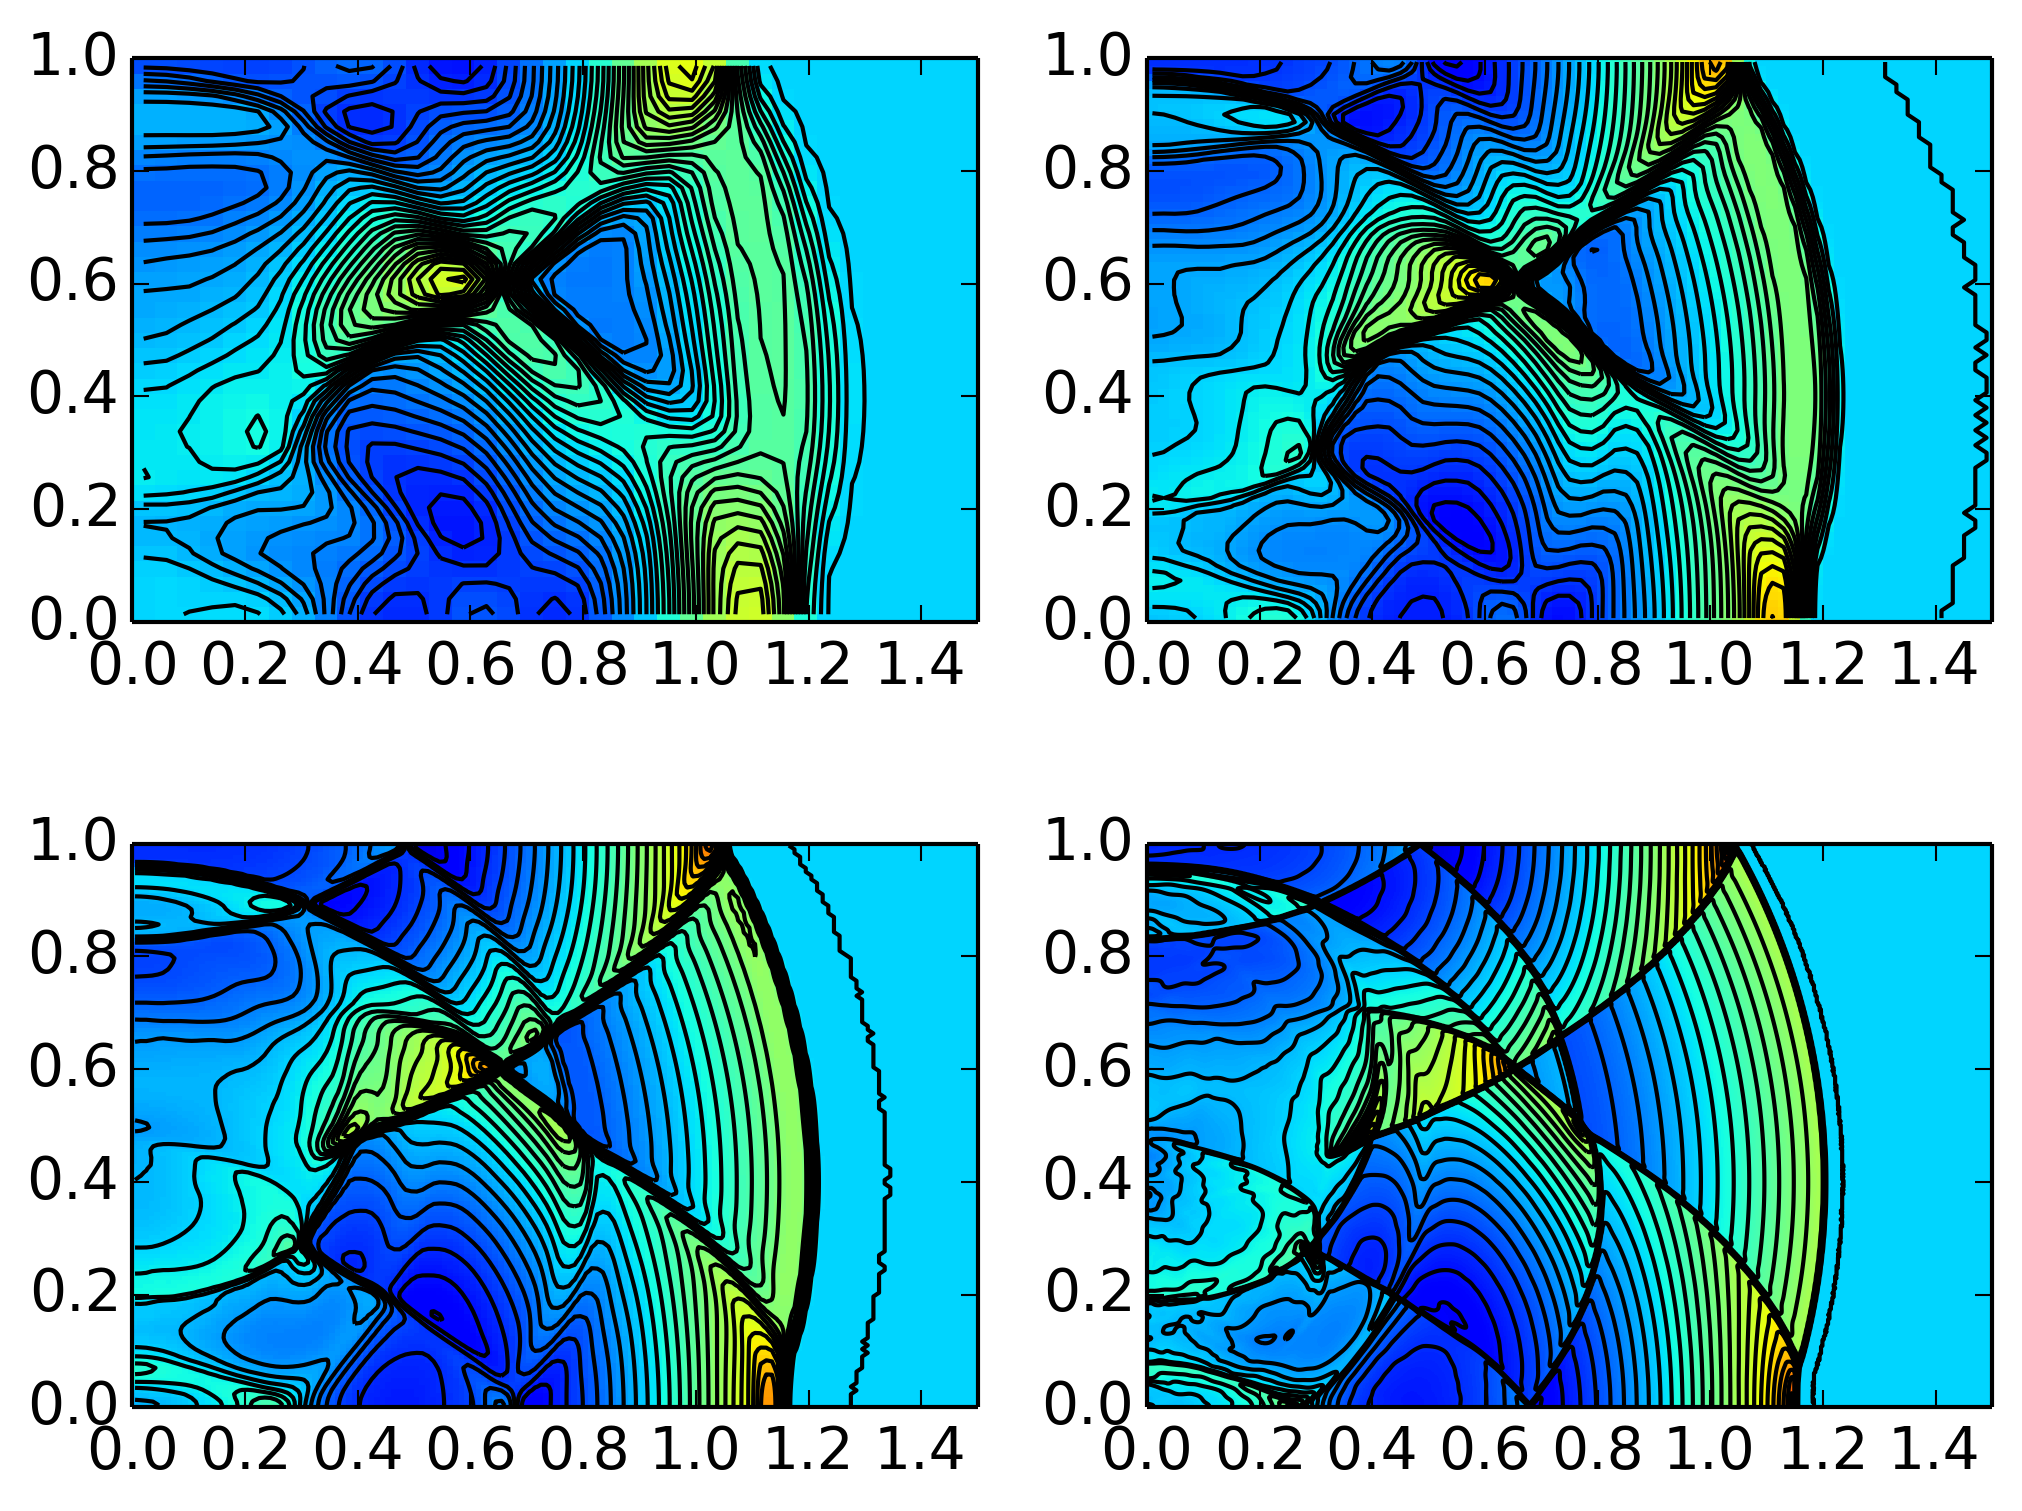
Color plot of pressure with superimposed contours (30 equally space contours are drawn) on a \(37\times 37\times 25\) [s408] (top left), \(75\times 75\times 50\) [s409] (top right) and \(150\times 150\times 300\) [s410] (bottom left) grid. The plot on the lower right shows the solution from the axisymmetric solver on a \(600\times 400\) [s411] grid. Even on the coarse mesh, the qualitative features of this complex flow are captured.
In the figure below lineouts of pressure in the XY plane at \(z=0.4\) are shown for each of the grid resolutions. For comparison, the solution from the high resolution 2D axisymmetric simulation are also shown. The figure shows that even with coarse resolution the solver gives qualitatively correct results, and that the axisymmetry in the 3D simulation is well maintained.
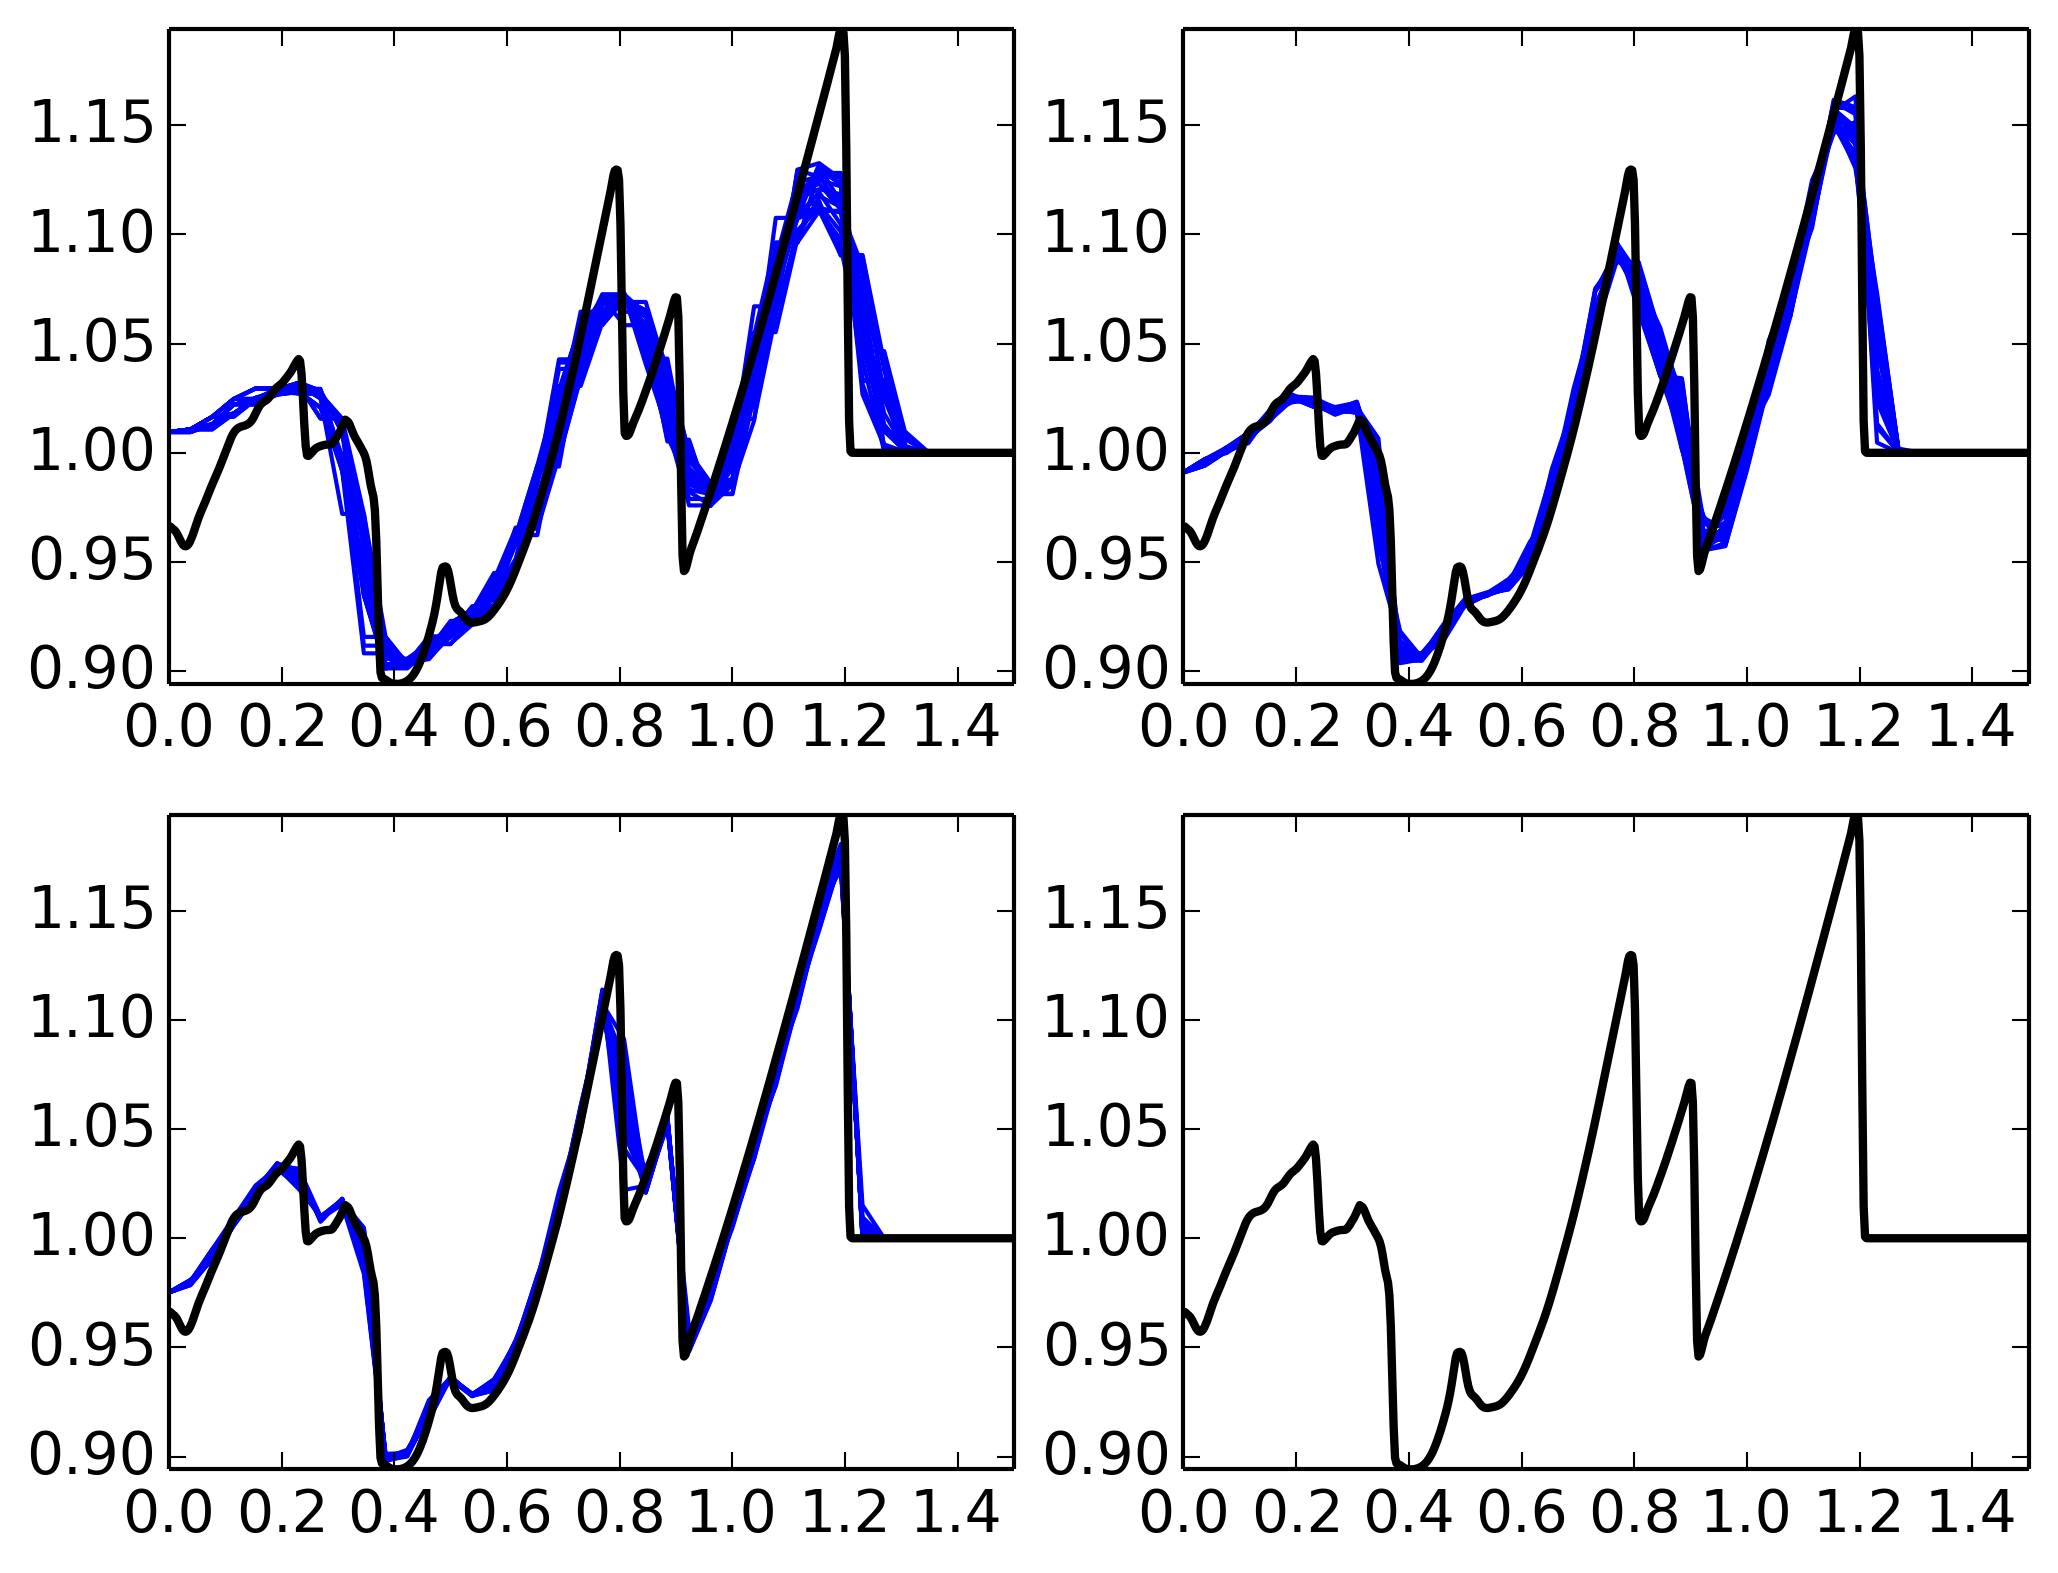
Lineouts of pressure in various directions in the XY plane at \(z=0.4\) are shown for \(37\times 37\times 25\) (top left), \(75\times 75\times 50\) (top right) and \(150\times 150\times 300\) (bottom left) grid. For comparison, the solution from the high resolution 2D axisymmetric simulation are also shown (black line). The figure shows that even with coarse resolution the solver gives qualitatively correct results, and that the axisymmetry in the 3D simulation is well maintained.
Vorticity generated by shock
In this problem shocks in interact with variable density regions, generating vorticity. Initially the gas is at rest. The pressure and density are unity everywhere, except for cylindrical regions perpendicular to each other. The radius of each region is \(r=0.2\) In the cylinder along the \(z\)-axis, the density is \(\rho=1\), but the pressure is \(p=10\), and thus cylindrical shock waves will emerge. The other cylinder is parallel to the \(y\)-axis, with symmetry axis \(x=0.4\) and \(z=0\). The pressure inside is \(p=1\), but the density is lower, \(\rho=0.1\). At \(x=0\), \(y=0\) and \(z=0\) planes symmetry boundary conditions are applied, while open boundary condition are applied elsewhere.
To display the structure of the solution a “schlieren” image is generated. For this, the quantity \(S=|\nabla\rho|\) is computed and plotted. Hence, regions of constant density appear with uniform color, while discontinuities become visible. The results are shown in the figures below, and compare well (eye-balled) with Figure 8 in [Langseth2000]. Note that the results in [Langseth2000] are smoother than the ones generated by Gkeyll. In particular, late in time there are corrugations on the shock surface parallel to the \(z\)-axis, which do not appear in [Langseth2000]. This could be simply a plotting issue, or due to the limiters used. Note that Gkeyll implements a dimensionally split algorithm, while [Langseth2000] implements an unsplit (with transverse terms) algorithm.
Note
These figures look really crappy. If anyone has suggestions for a good 3D plotting program, please let me know. I am using Visit, which is less that satisfactory, to put it mildly.
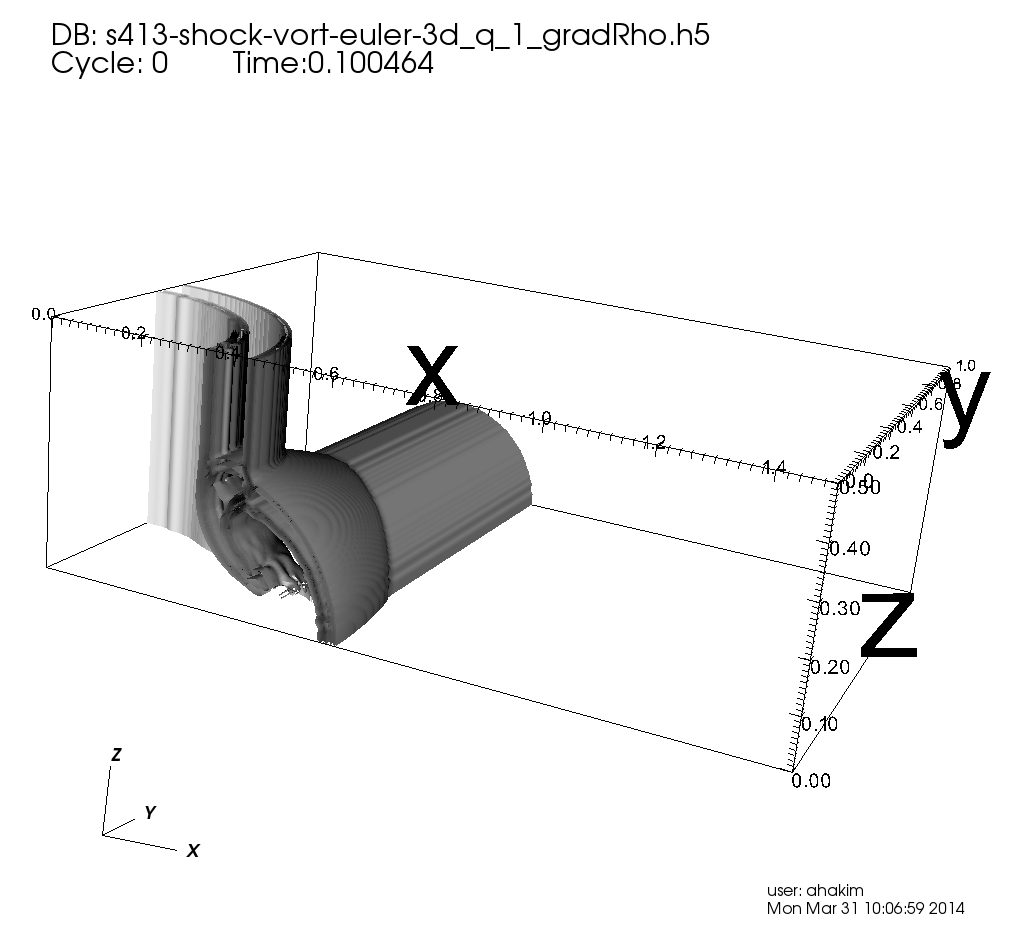
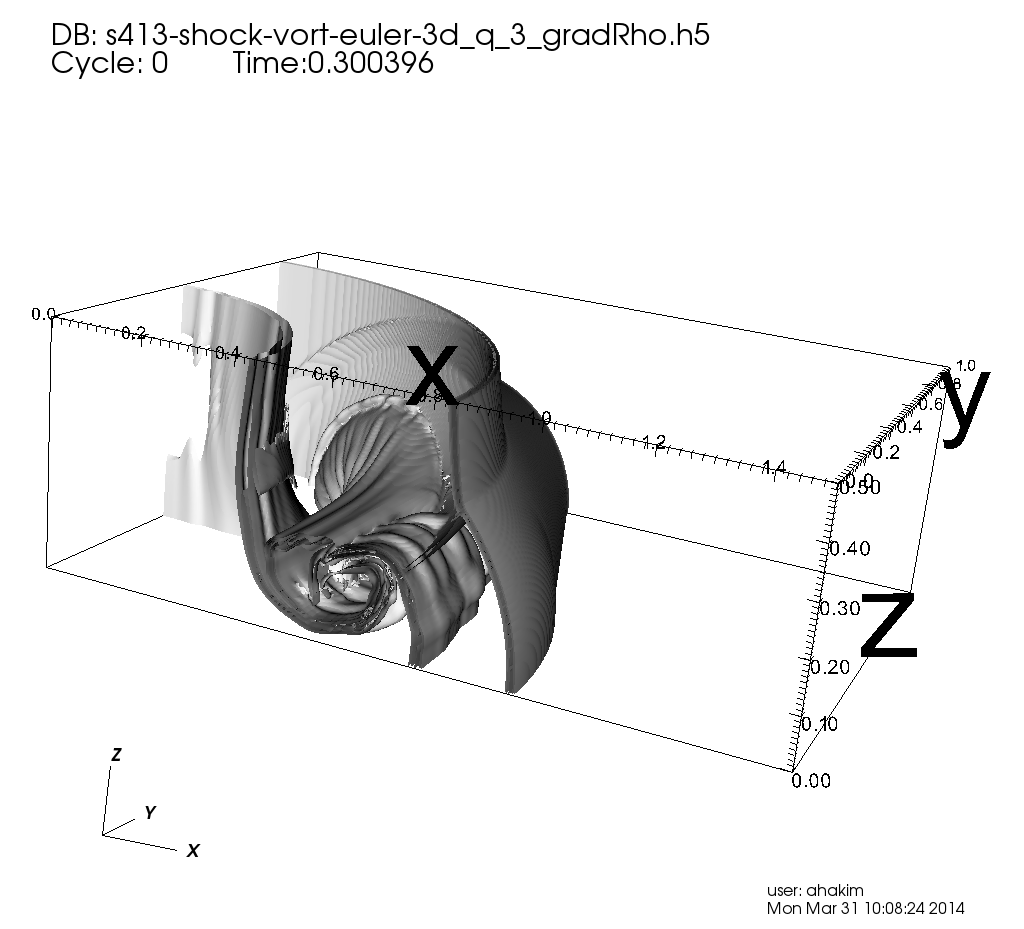
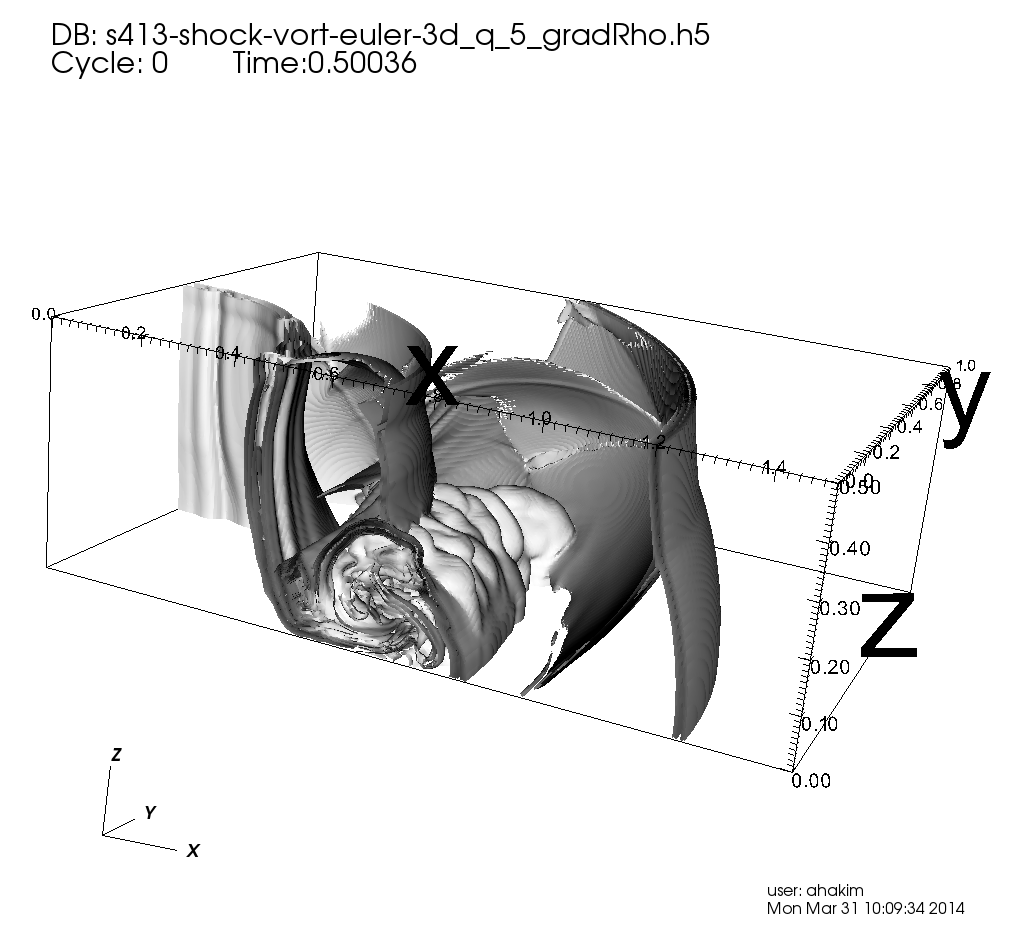
Schlieren plots (\(|\nabla\rho|\)) at \(t=0.1\), \(t=0.3\) and \(t=0.5\) from shock generated vorticity problem. See [s413] for Lua script for this problem.
On solving axisymmetric Euler equations
In axisymmetric systems, the most convenient way to solve the Euler (or other) equations is to use \((r,\theta,z)\) coordinates, setting \(\partial/\partial\theta = 0\). The gradient and divergence operators now include metric terms, which means that one needs to develop special solvers. However, one can use a trick to expand the derivatives, and move algebraic terms to the right hand side, obtaining a system which is identical the Cartesian system, except with source terms. This procedure is adpoted in Gkeyll. This allows reuse of the same solvers, but with “axisymmetric” source terms and obtain a solver for axisymmetric Euler equations. These sources are
where we now interpret \(u\) as the radial velocity, \(v\) as the azimuthal velocity (in the \(\theta\) direction), and \(w\) as the axial velocity.
Conclusions
Basic tests of 3D Euler dimensionally split algorithm show that the Gkeyll solvers are working correctly. Issues of plotting remain, but these have nothing to do with the solver itself.
