JE22: Benchmarking dimensionally split finite-volume scheme for 2D Euler equations
In this note, I simulate a number of benchmark problems for the 2D Euler equations. The scheme is a finite-volume wave-propagation algorithm. Dimensional splitting is used. I.e. denoting the X-direction update schematically by the operator \(\exp(\mathcal{L}_x\Delta t)\) and the Y-direction update by \(\exp(\mathcal{L}_y\Delta t)\), the scheme can be written as
I.e. the X-direction update is performed first, and then the Y-direction update. Another option is to use an unsplit scheme (i.e. in which transverse solvers are included, see [LeVeque2002]). Both split and unsplit (with transverse solvers) schemes allow a maximum CFL number of 1.0, and are second order accurate. However, an unsplit scheme without transverse solvers has a stability CFL of 0.5, making it inefficient compared to the split scheme.
As the scheme uses a Roe Riemann solver, the density and/or pressure can sometimes become negative. To prevent this from crashing the code, on detection of a positivity violation, the step is rejected and taken again using a Lax flux. This ensures that the solution remains positive, as Lax fluxes maintain positivity. However, use of Lax flux can add more diffusion to the scheme. As positivity violations occur infrequently, or not at all, this does not have a major impact on the overall solution quality. Note that the use of a Lax flux still conserves total mass, momentum and density, and hence is preferable to the ad-hoc procedure of setting a density/pressure floor that can cause uncontrolled mass and energy conservation errors.
Some of the problems are taken from a paper by Liska and Wendroff [Liska2003] that compares a whole set of numerical methods for Euler equations on various 1D and 2D problems. The 1D Euler solver has already been tested in JE2, and so only the 2D scheme is tested here.
Smooth periodic problem
To check convergence, an exact smooth traveling wave solution
where \(u=1, v=-1/2, p=1\), are the constant velocity and pressure of the fluid, is used to initialize the problem. The domain is \(2\times 2\) and a sequence of grids, \(25\times 25\), \(50\times 50\), \(100\times 100\) and \(200\times 200\) are used. The gas adiabatic index is set to \(\gamma=1.4\). The simulation is run to \(t=4\), at which point the wave has traversed the domain once.
The time-step is the same for each resolution to ensure that only the convergence rate of the spatial scheme is tested. Errors are measured using the \(L_2\) norm of the error in density. The results are presented in the table below.
Grid size \(\Delta x\) |
Average error |
Order |
Simulation |
|---|---|---|---|
\(0.08\) |
\(8.61153\times 10^{-5}\) |
||
\(0.04\) |
\(5.28259\times 10^{-6}\) |
\(4.02\) |
|
\(0.02\) |
\(2.98383\times 10^{-7}\) |
\(4.15\) |
|
\(0.01\) |
\(1.16211\times 10^{-8}\) |
\(4.68\) |
Note
I am not sure why the scheme converges with 4th order accuracy, rather than second order accuracy, as it should. Perhaps this is not a sufficiently good test, and the errors are very small to start off with, even on coarse grid. Also, the scheme is run without limiters, perhaps making the scheme look more accurate than it really is.
Gaussian pulse in a box
In this test, the gas is initially at rest with \(\rho=1.0\) and with a Gaussian pulse added to the background pressure
where \(r^2=(x-x_c)^2 + (y-y_c)^2\), \((x_c,y_c)\) being the domain center, and \(\beta=50.0\). The domain is bounded by walls. This sets up sound waves that slosh around the box, forming complex interference patterns. The aim of this test is to check the energy conservation properties of the scheme with wall boundary conditions.
The time-history of the fluid energy is shown in the following figure.
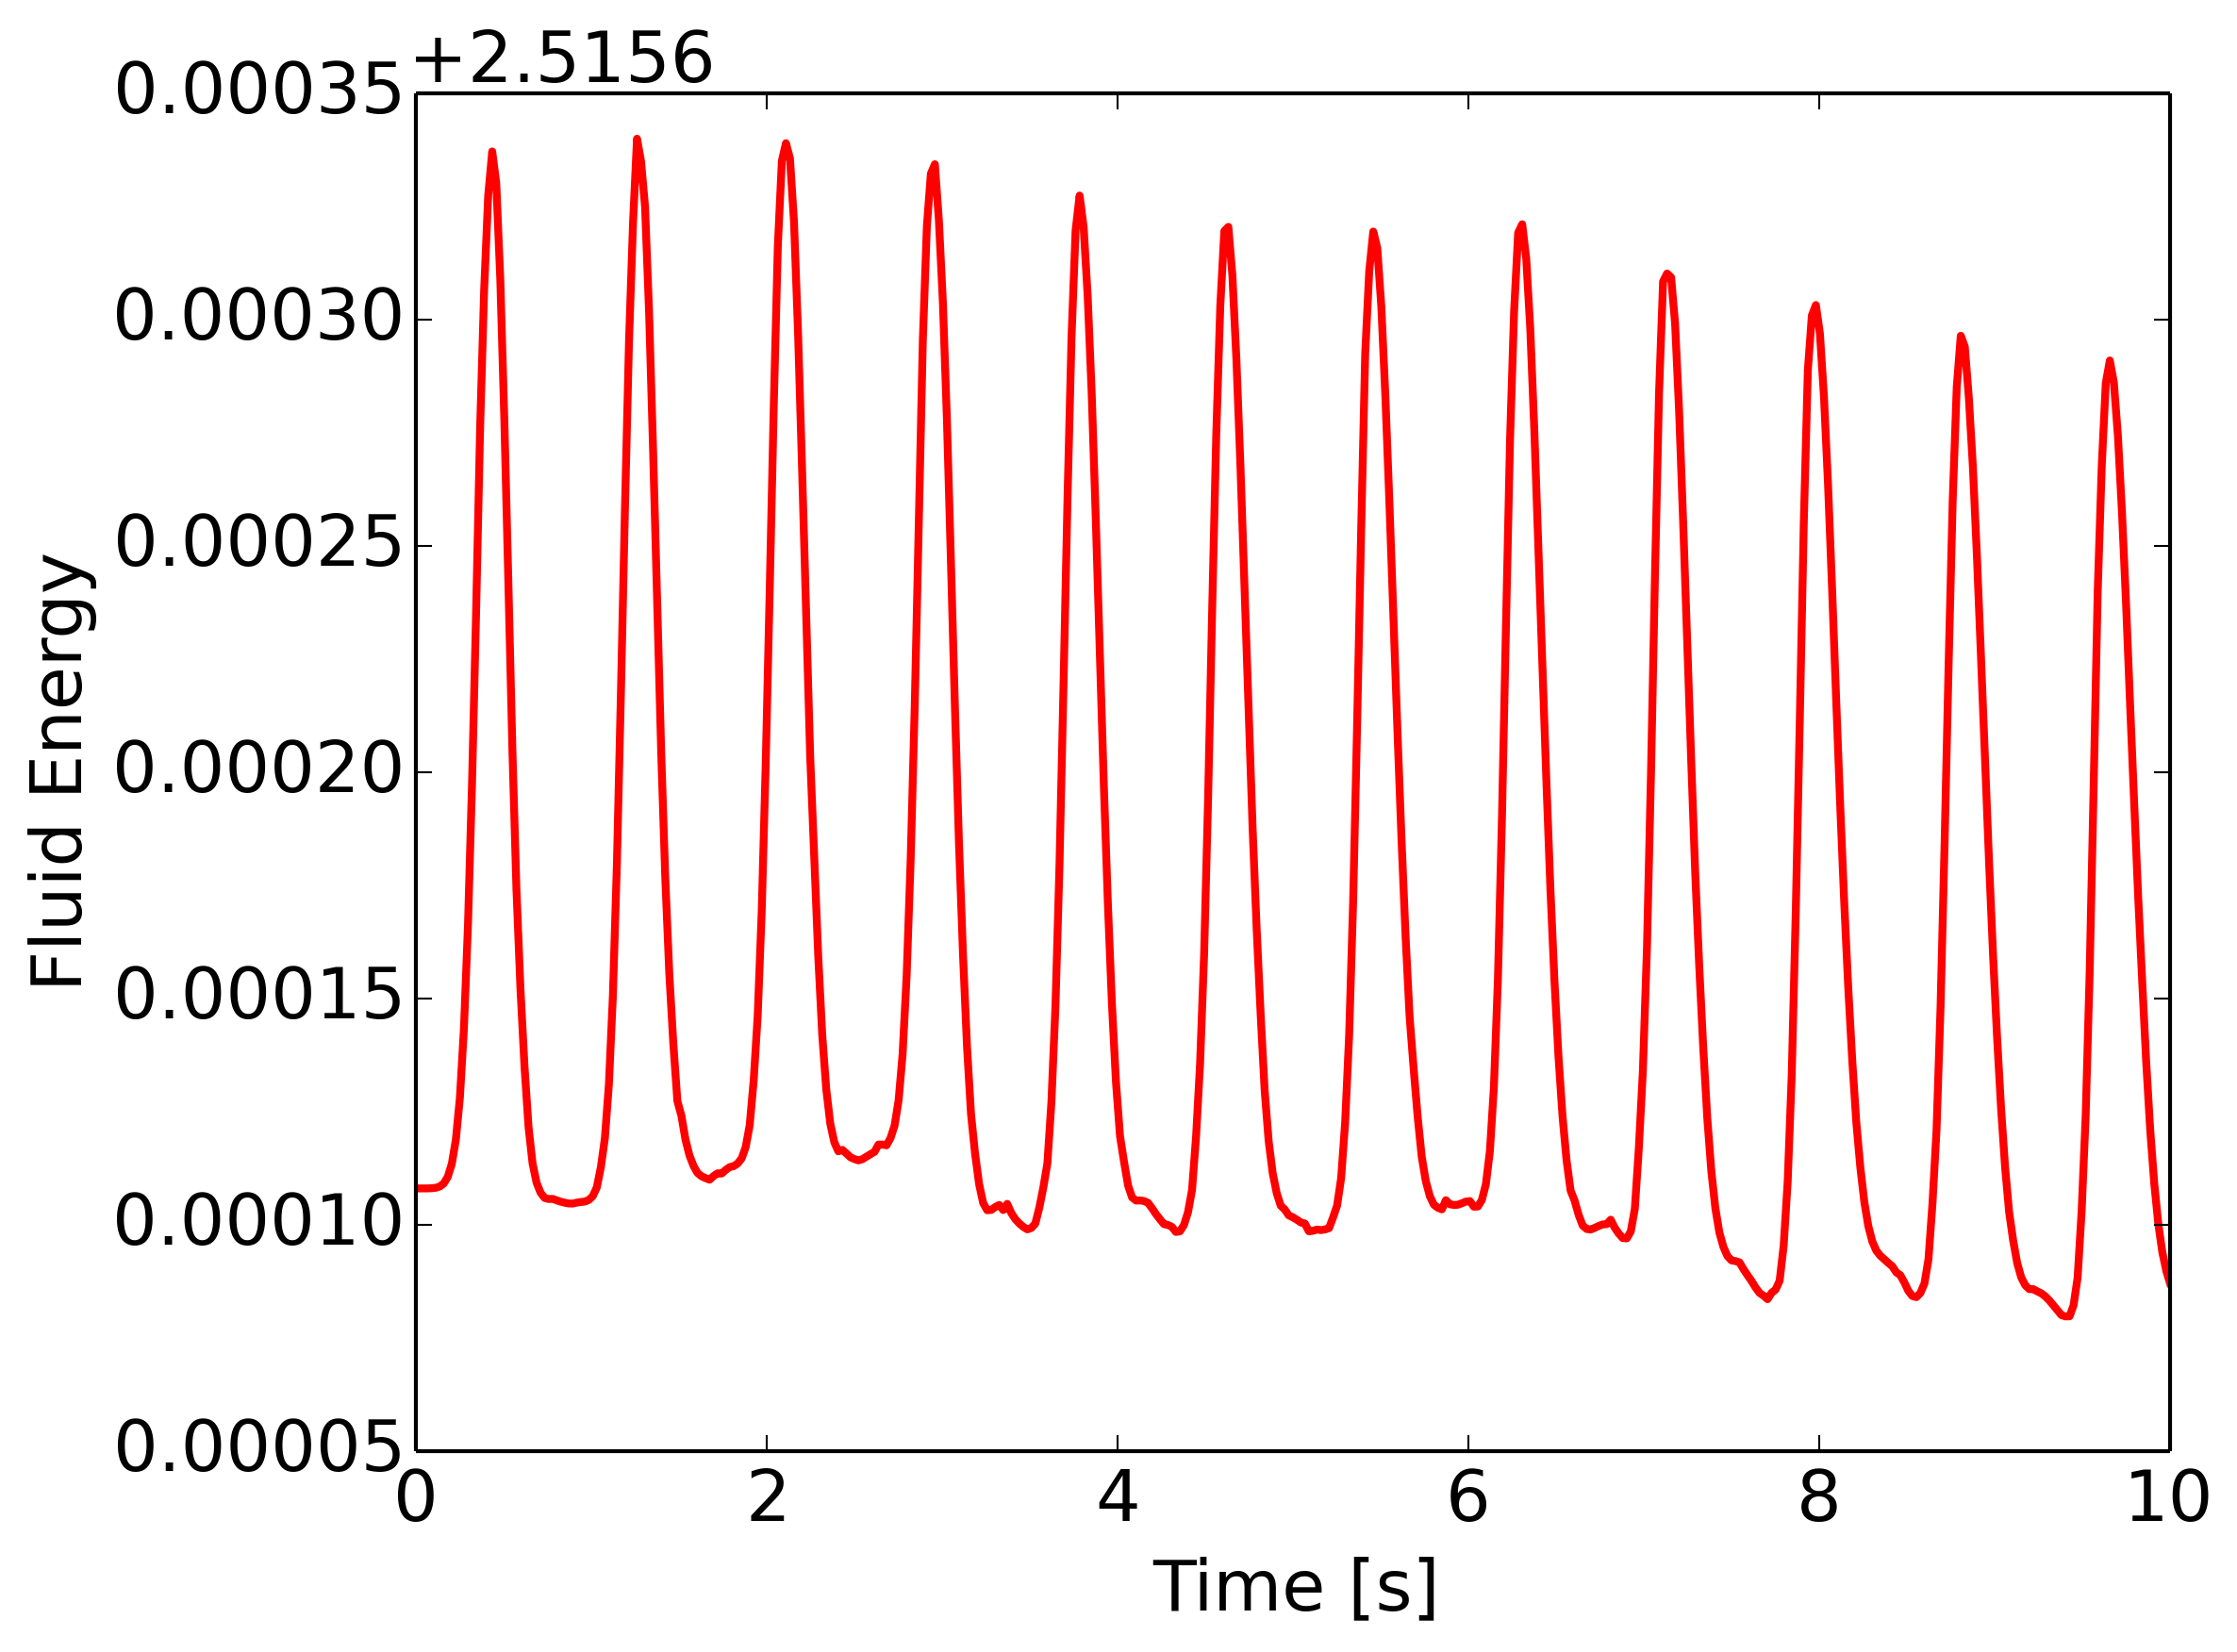
Time history of fluid energy for pulse in box problem [s393]. The total energy should remain constant, however, fluctuates slightly, by about 0.01 percent, due to small inconsistency (see main text) in the wall flux caused by the upwinding. The fluctuations correspond to sound waves hitting the wall.
The plot shows that the total energy is not exactly conserved, however, fluctuates slightly, by about 0.01%. These errors can be traced to the numerical flux used on the domain boundary, i.e. the wall. Consider, for example, Lax fluxes
where \(\mathbf{F}_{i+1/2}\) is the numerical flux, \(\lambda\) is the maximum eigenvalue in cells \(i,i+1\), \(\mathbf{f}_{i}\) is the physical flux, and \(\mathbf{q}_{i}\) is the conserved variable. For 1D Euler equation we have
At the wall, the boundary conditions are obtained by copying into the ghost cell the density and energy, and copying with a sign flip, the normal velocity. Hence, the flux of mass and energy into the domain vanishes in the first term in the numerical flux, but the flux of normal momentum is incorrect due to the second, “diffusive” term, leading to an error in the total momentum and hence energy conservation. Setting \(\lambda=0\) in the cell edges on a wall will make the energy conservation exact, however, complicating the algorithm somewhat.
2D Riemann problems
In this section, a set of 2D problems are simulated. The parameters are taken from Table 4.3 in [Liska2003], using the same labels to identify the simulations. The problems are solved on a square with unit side, initially divided into four quadrants, filled with fluid with uniform state in a quadrant. The jumps across the fluid quantities across quadrants cause a complex set of waves consisting of shocks, rarefactions and contact slips.
There is no exact solution to these problems, and so an “eye-ball metric” is used to study the quality of the solution by comparing with figures in [Liska2003]. In each case, it is found that the results produced by Gkeyll are almost identical to the results published in [Liska2003]. Note that they only show solutions for Case 3, 12 and 15. I have included plots from all tests here for reference. Details for each simulation (initial conditions, etc.) are available by clicking on the link to the Lua script in the figure caption.
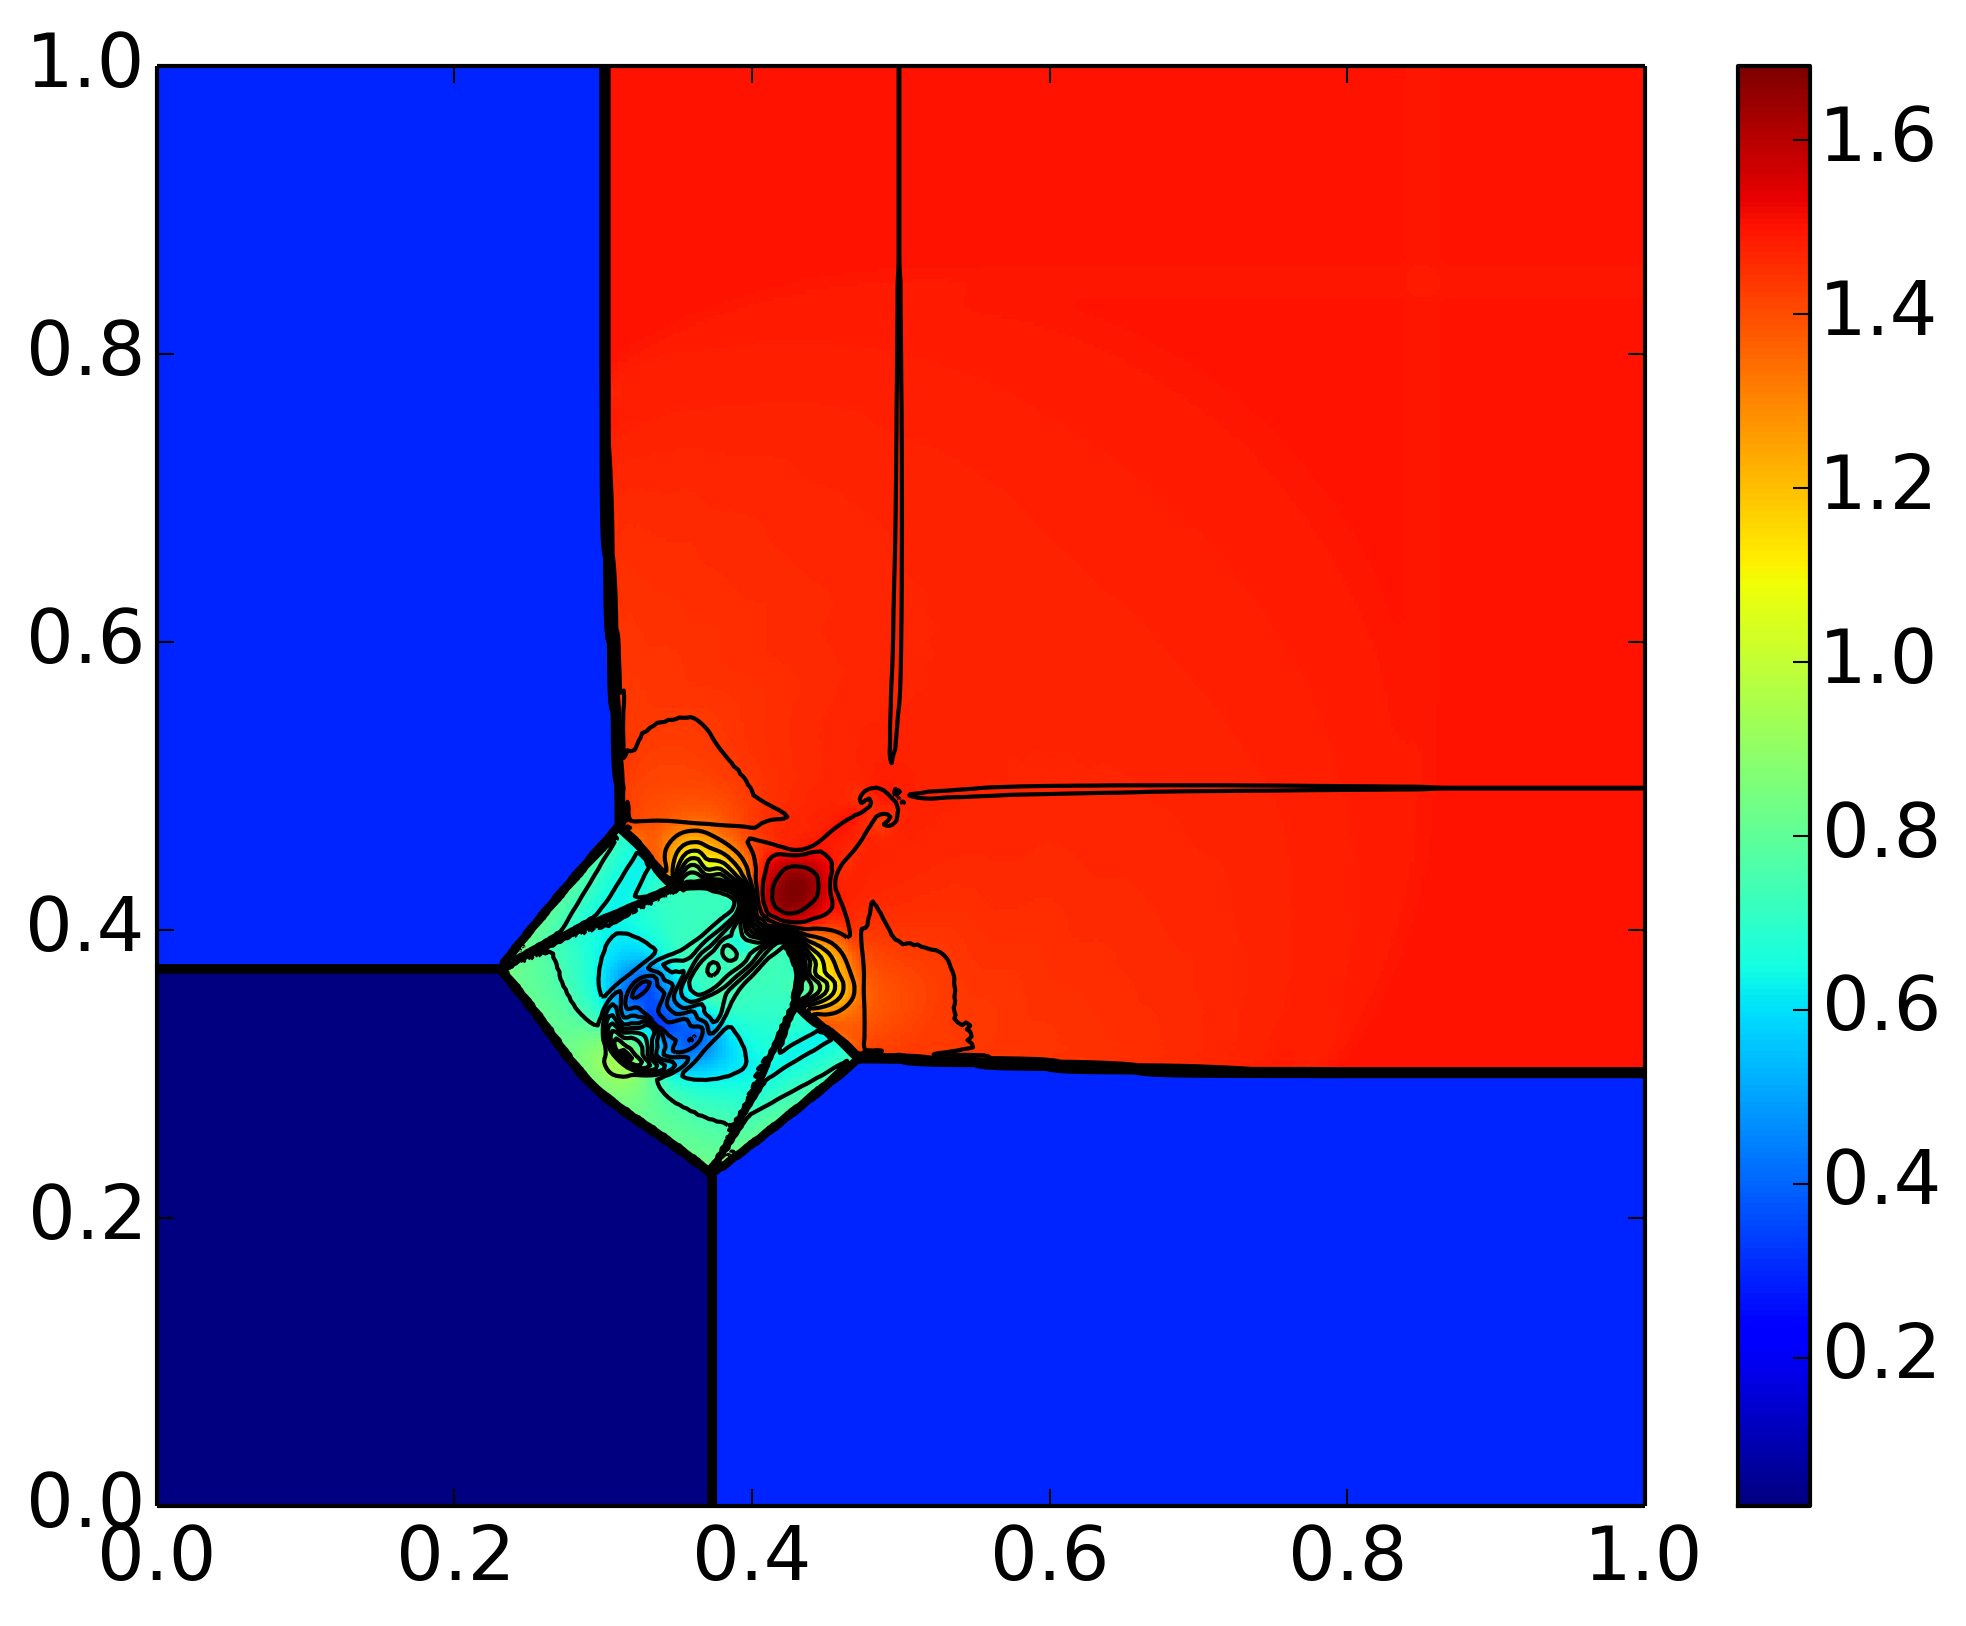
Results of 2D Riemann problem from Case 3. Pressure is displayed in color and density contours are superimposed. For detail see [s394].
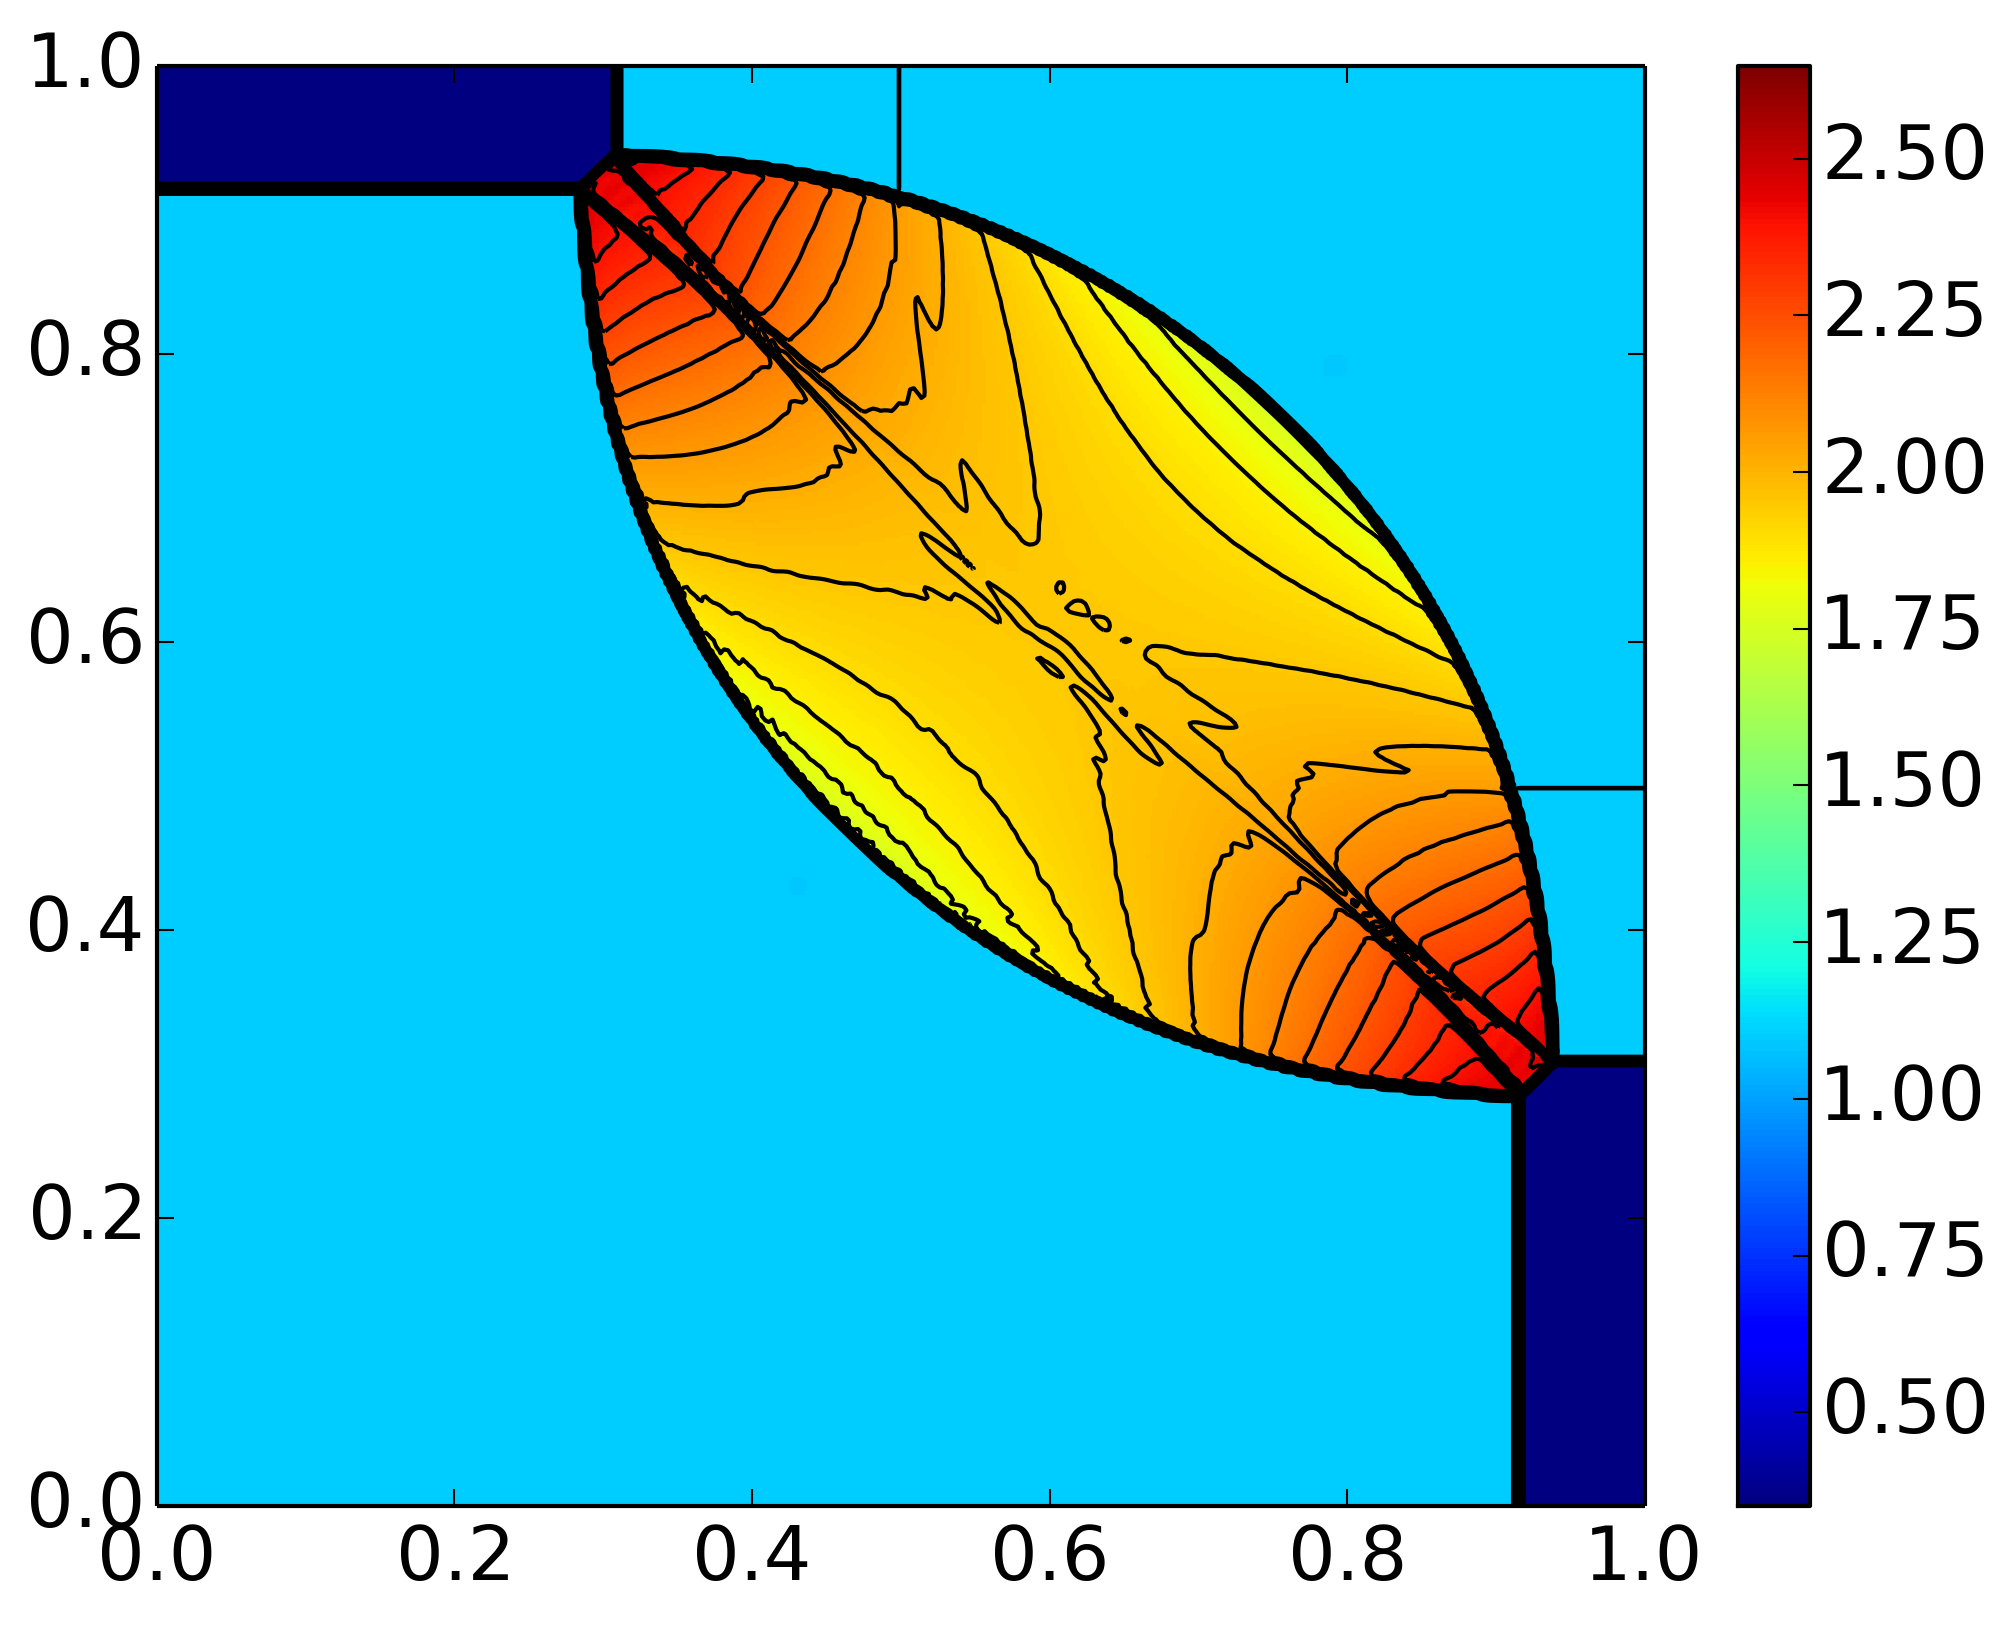
Results of 2D Riemann problem from Case 4. Pressure is displayed in color and density contours are superimposed. For detail see [s395].
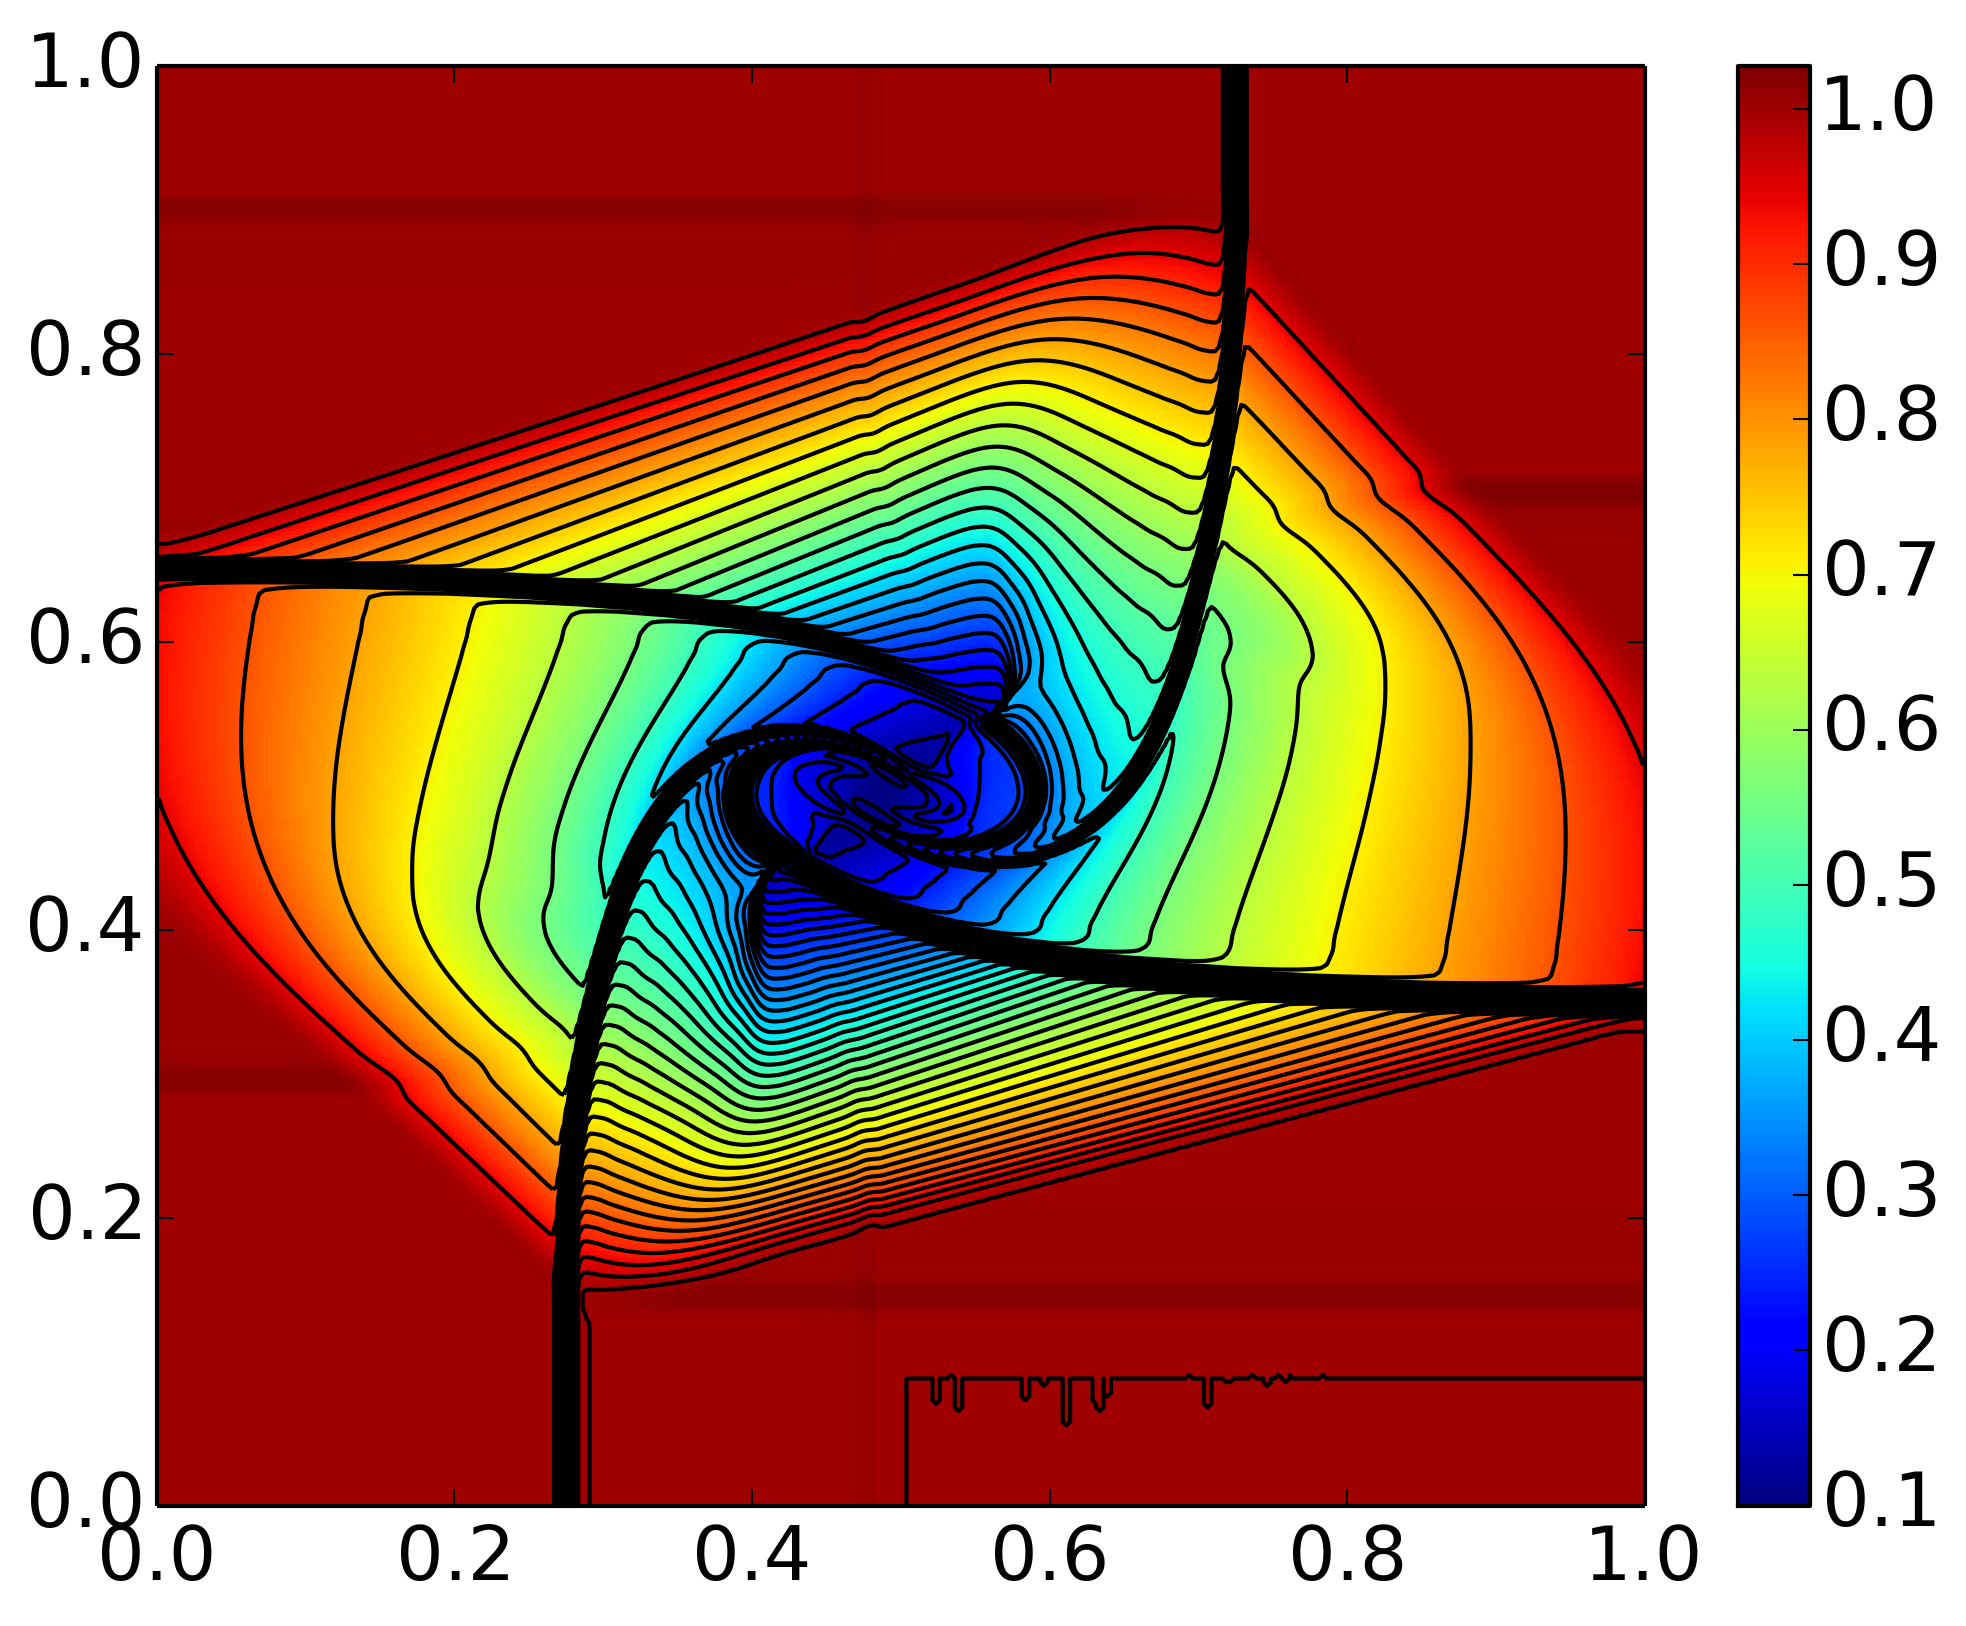
Results of 2D Riemann problem from Case 6. Pressure is displayed in color and density contours are superimposed. For detail see [s396].
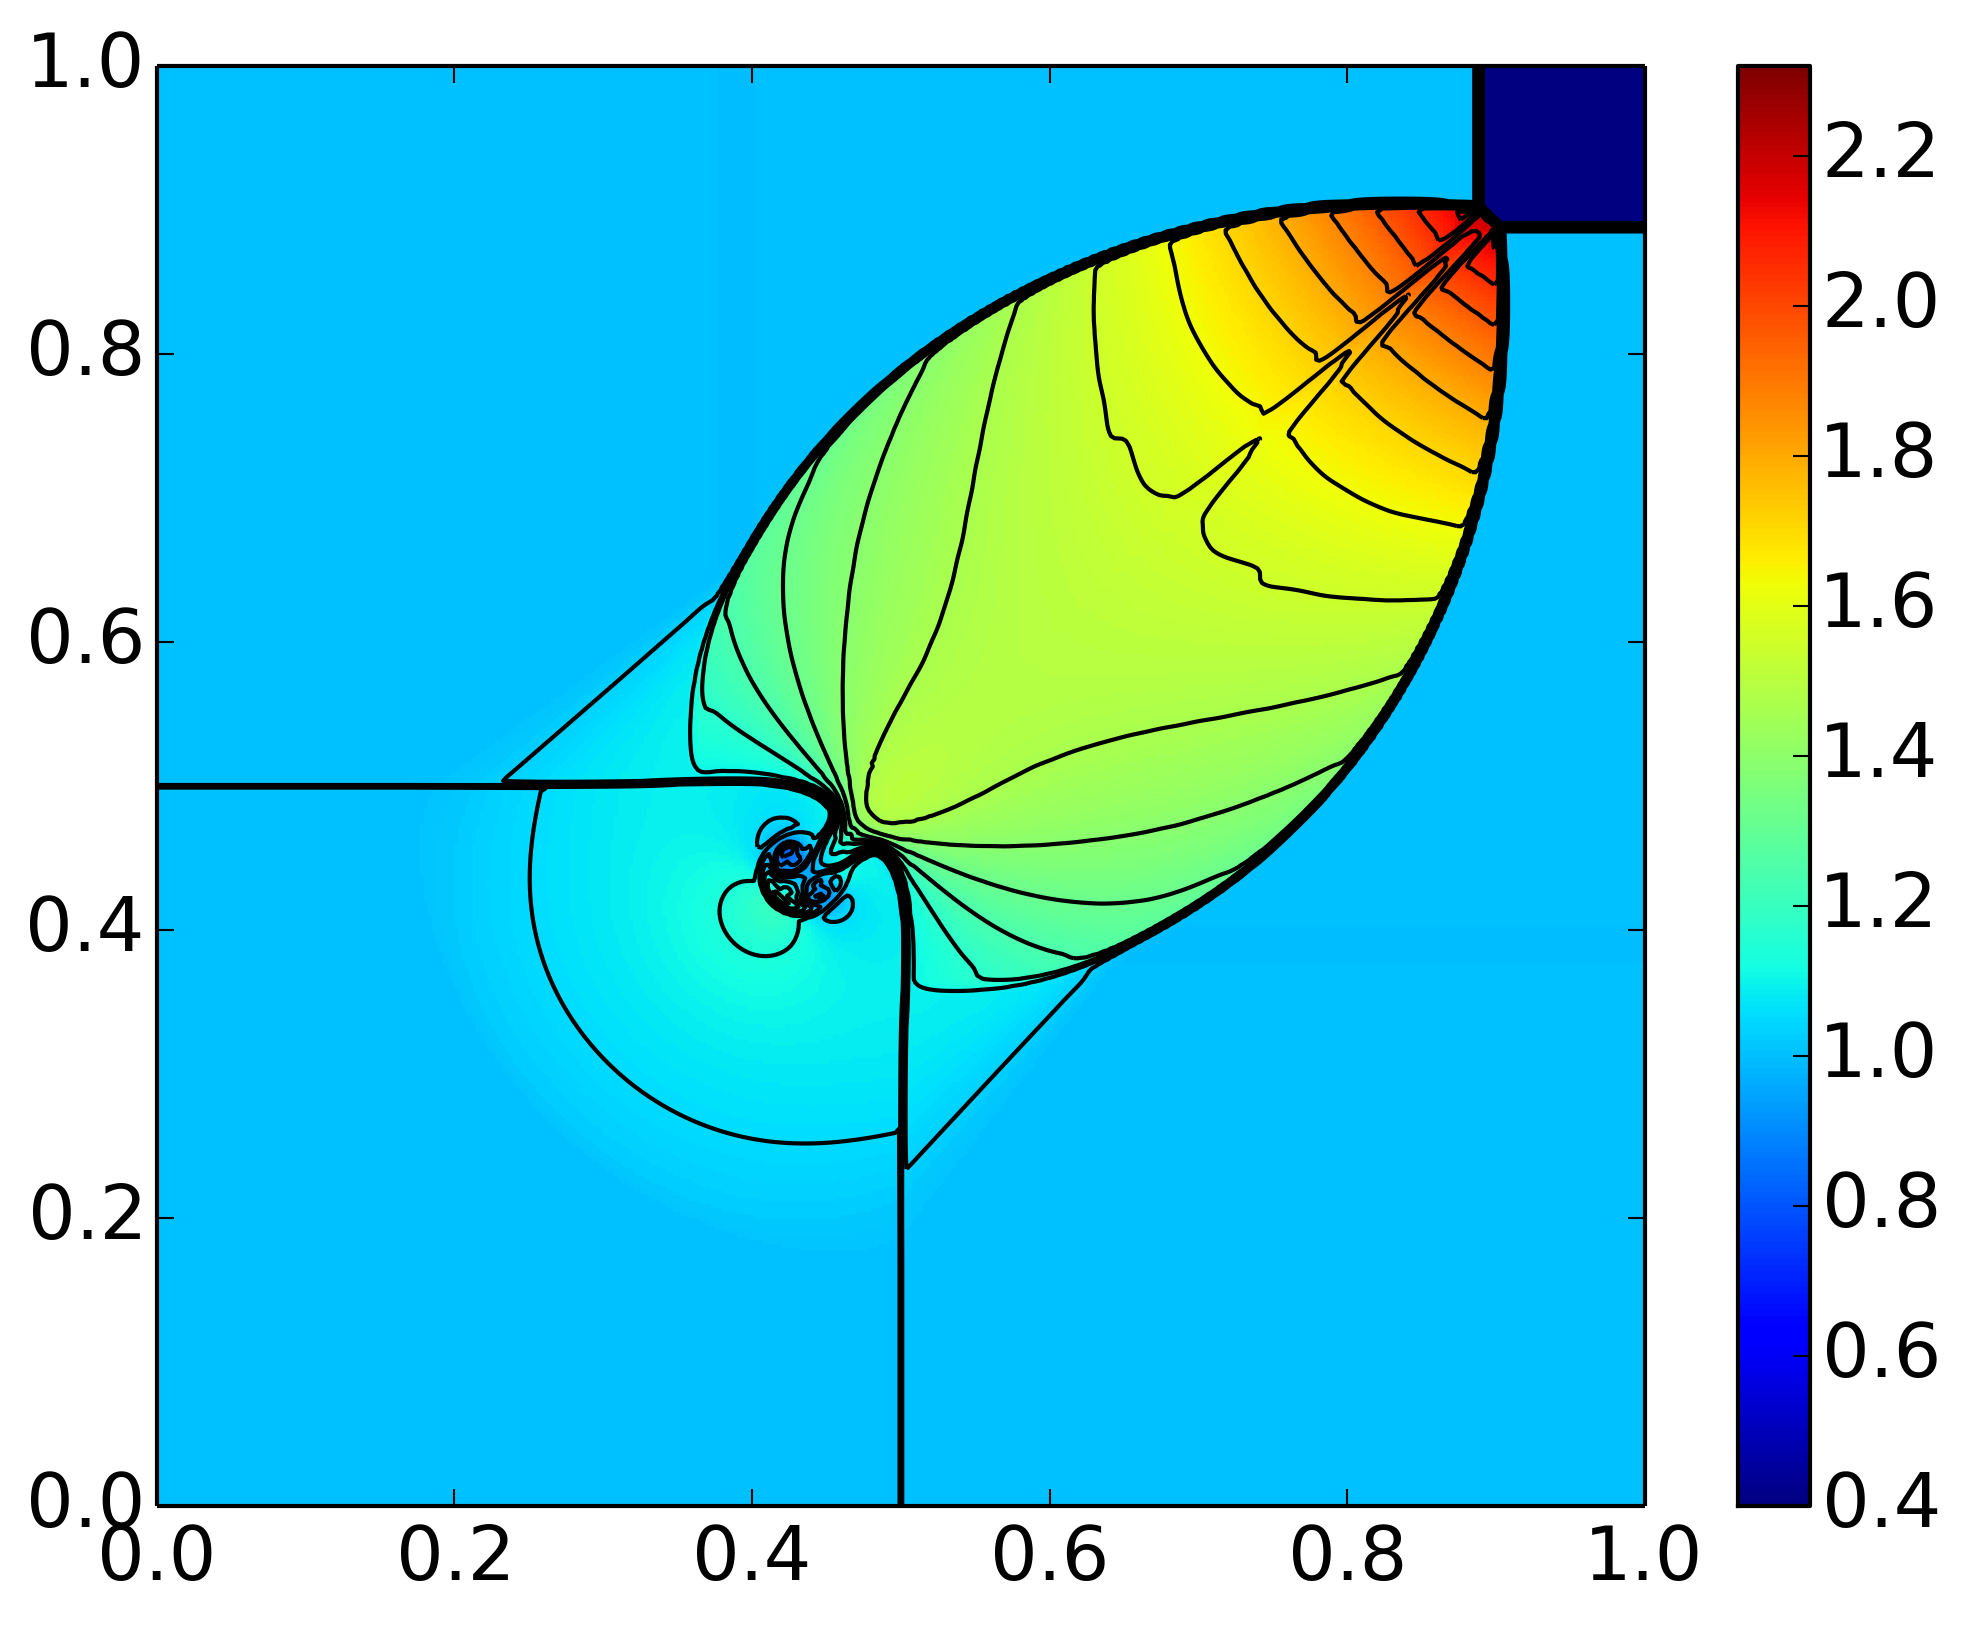
Results of 2D Riemann problem from Case 12. Pressure is displayed in color and density contours are superimposed. For detail see [s397].
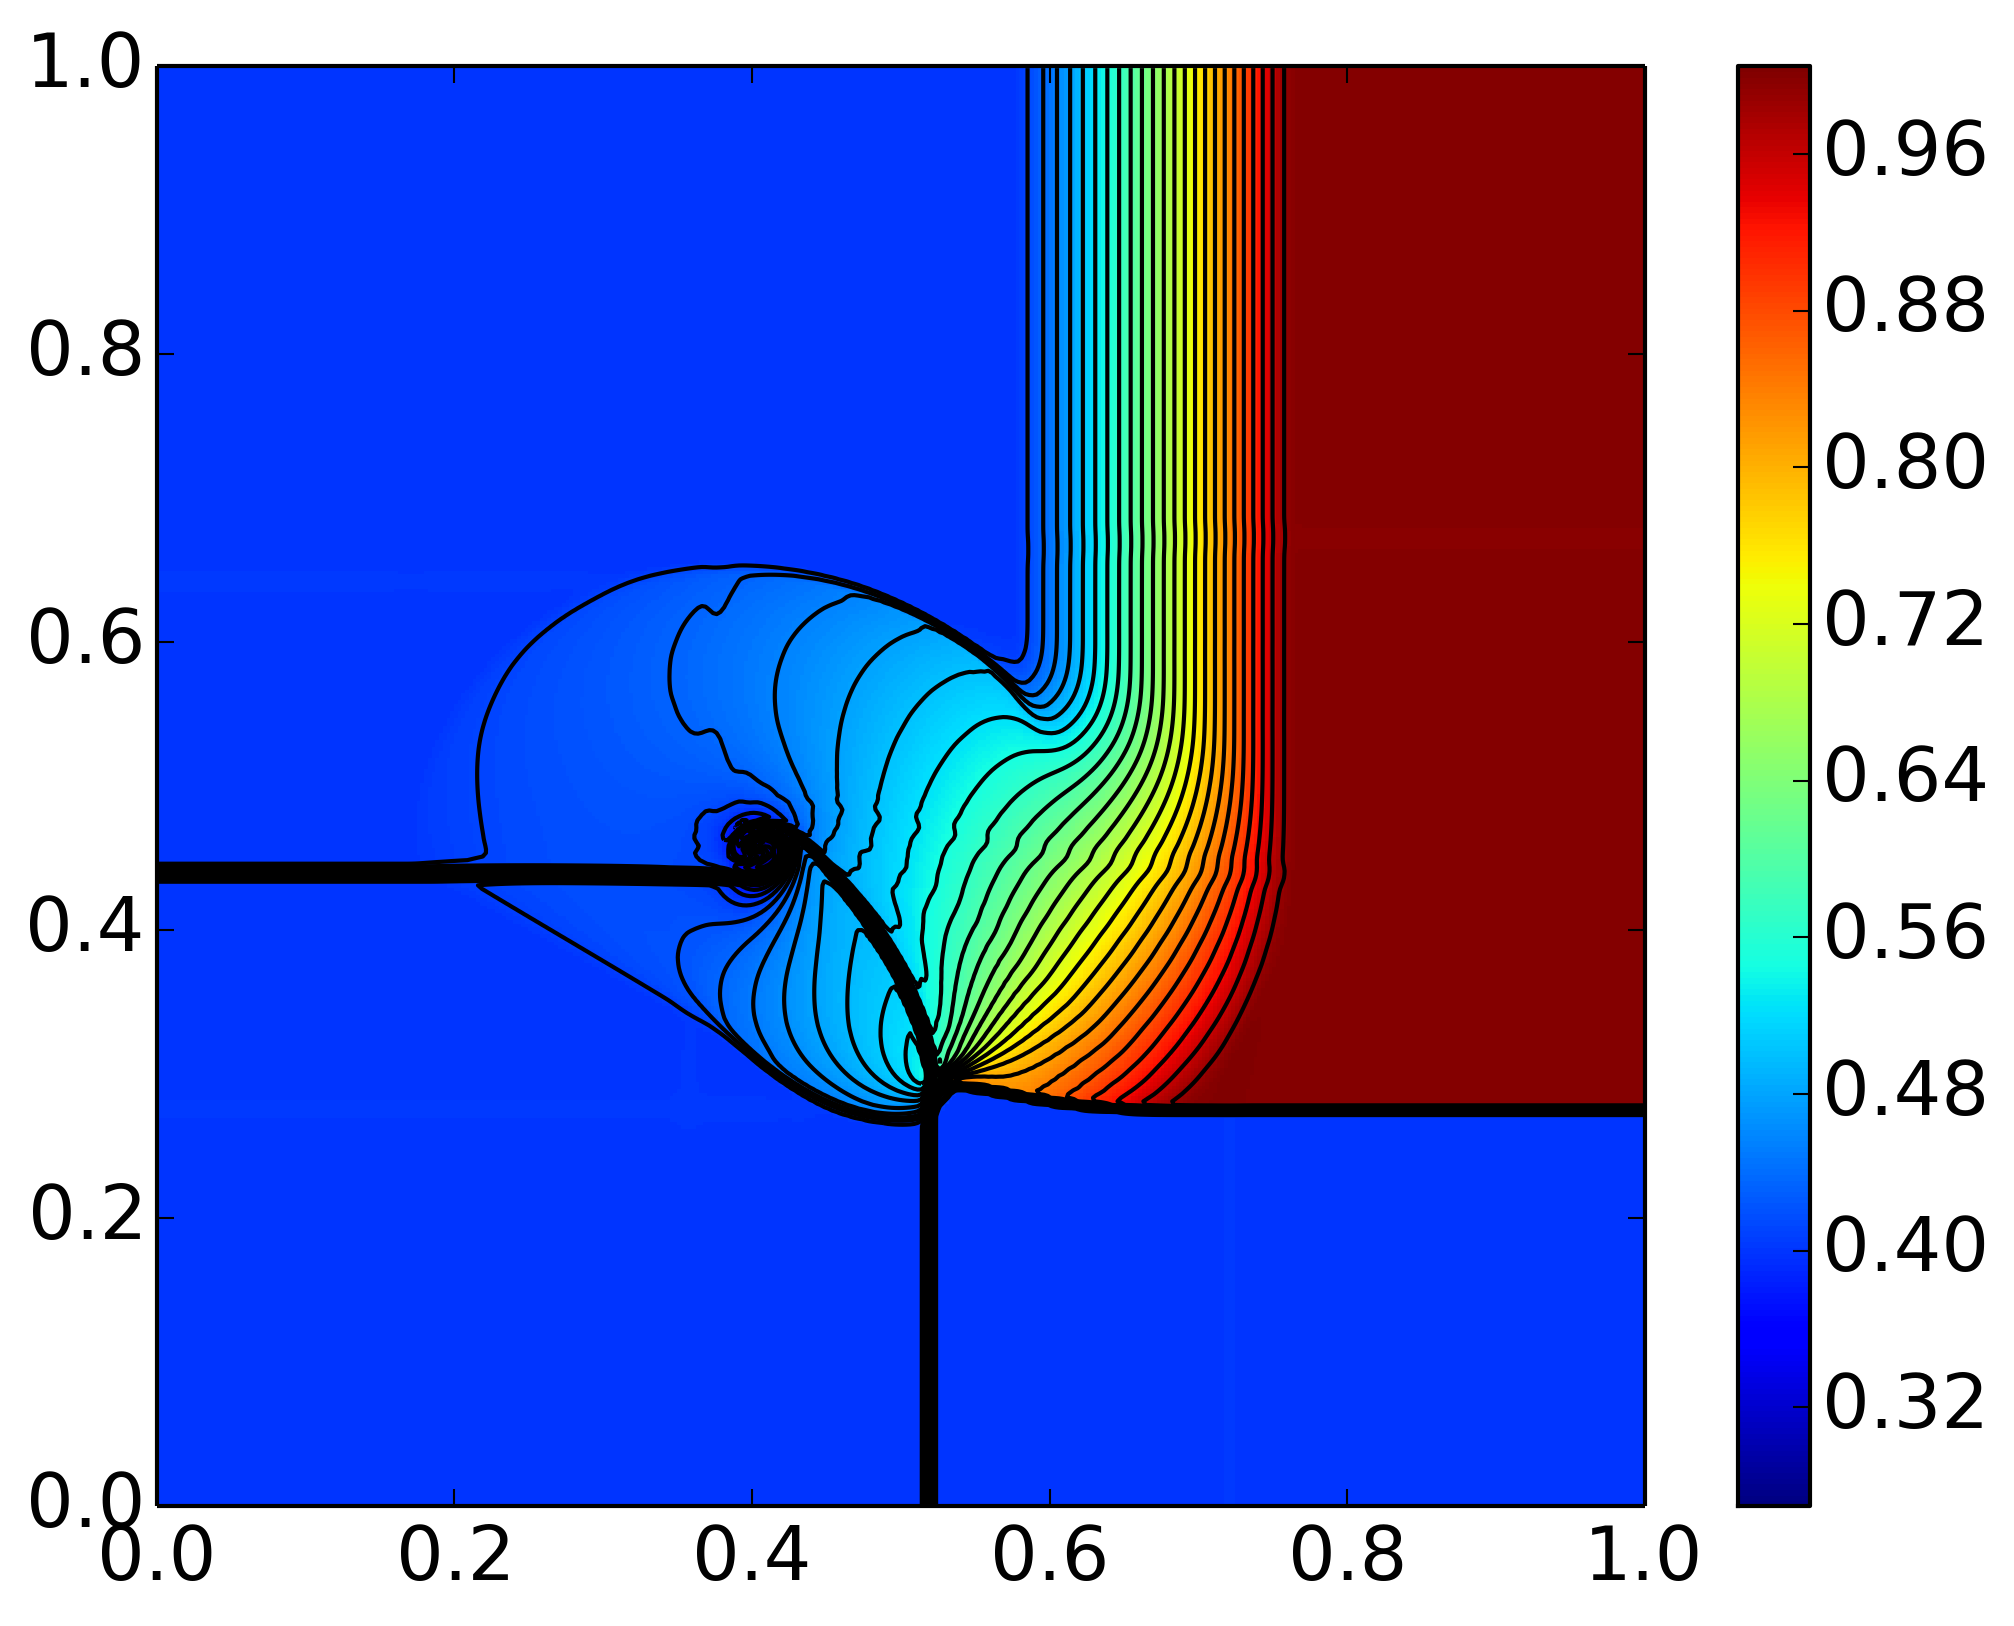
Results of 2D Riemann problem from Case 15. Pressure is displayed in color and density contours are superimposed. For detail see [s398].
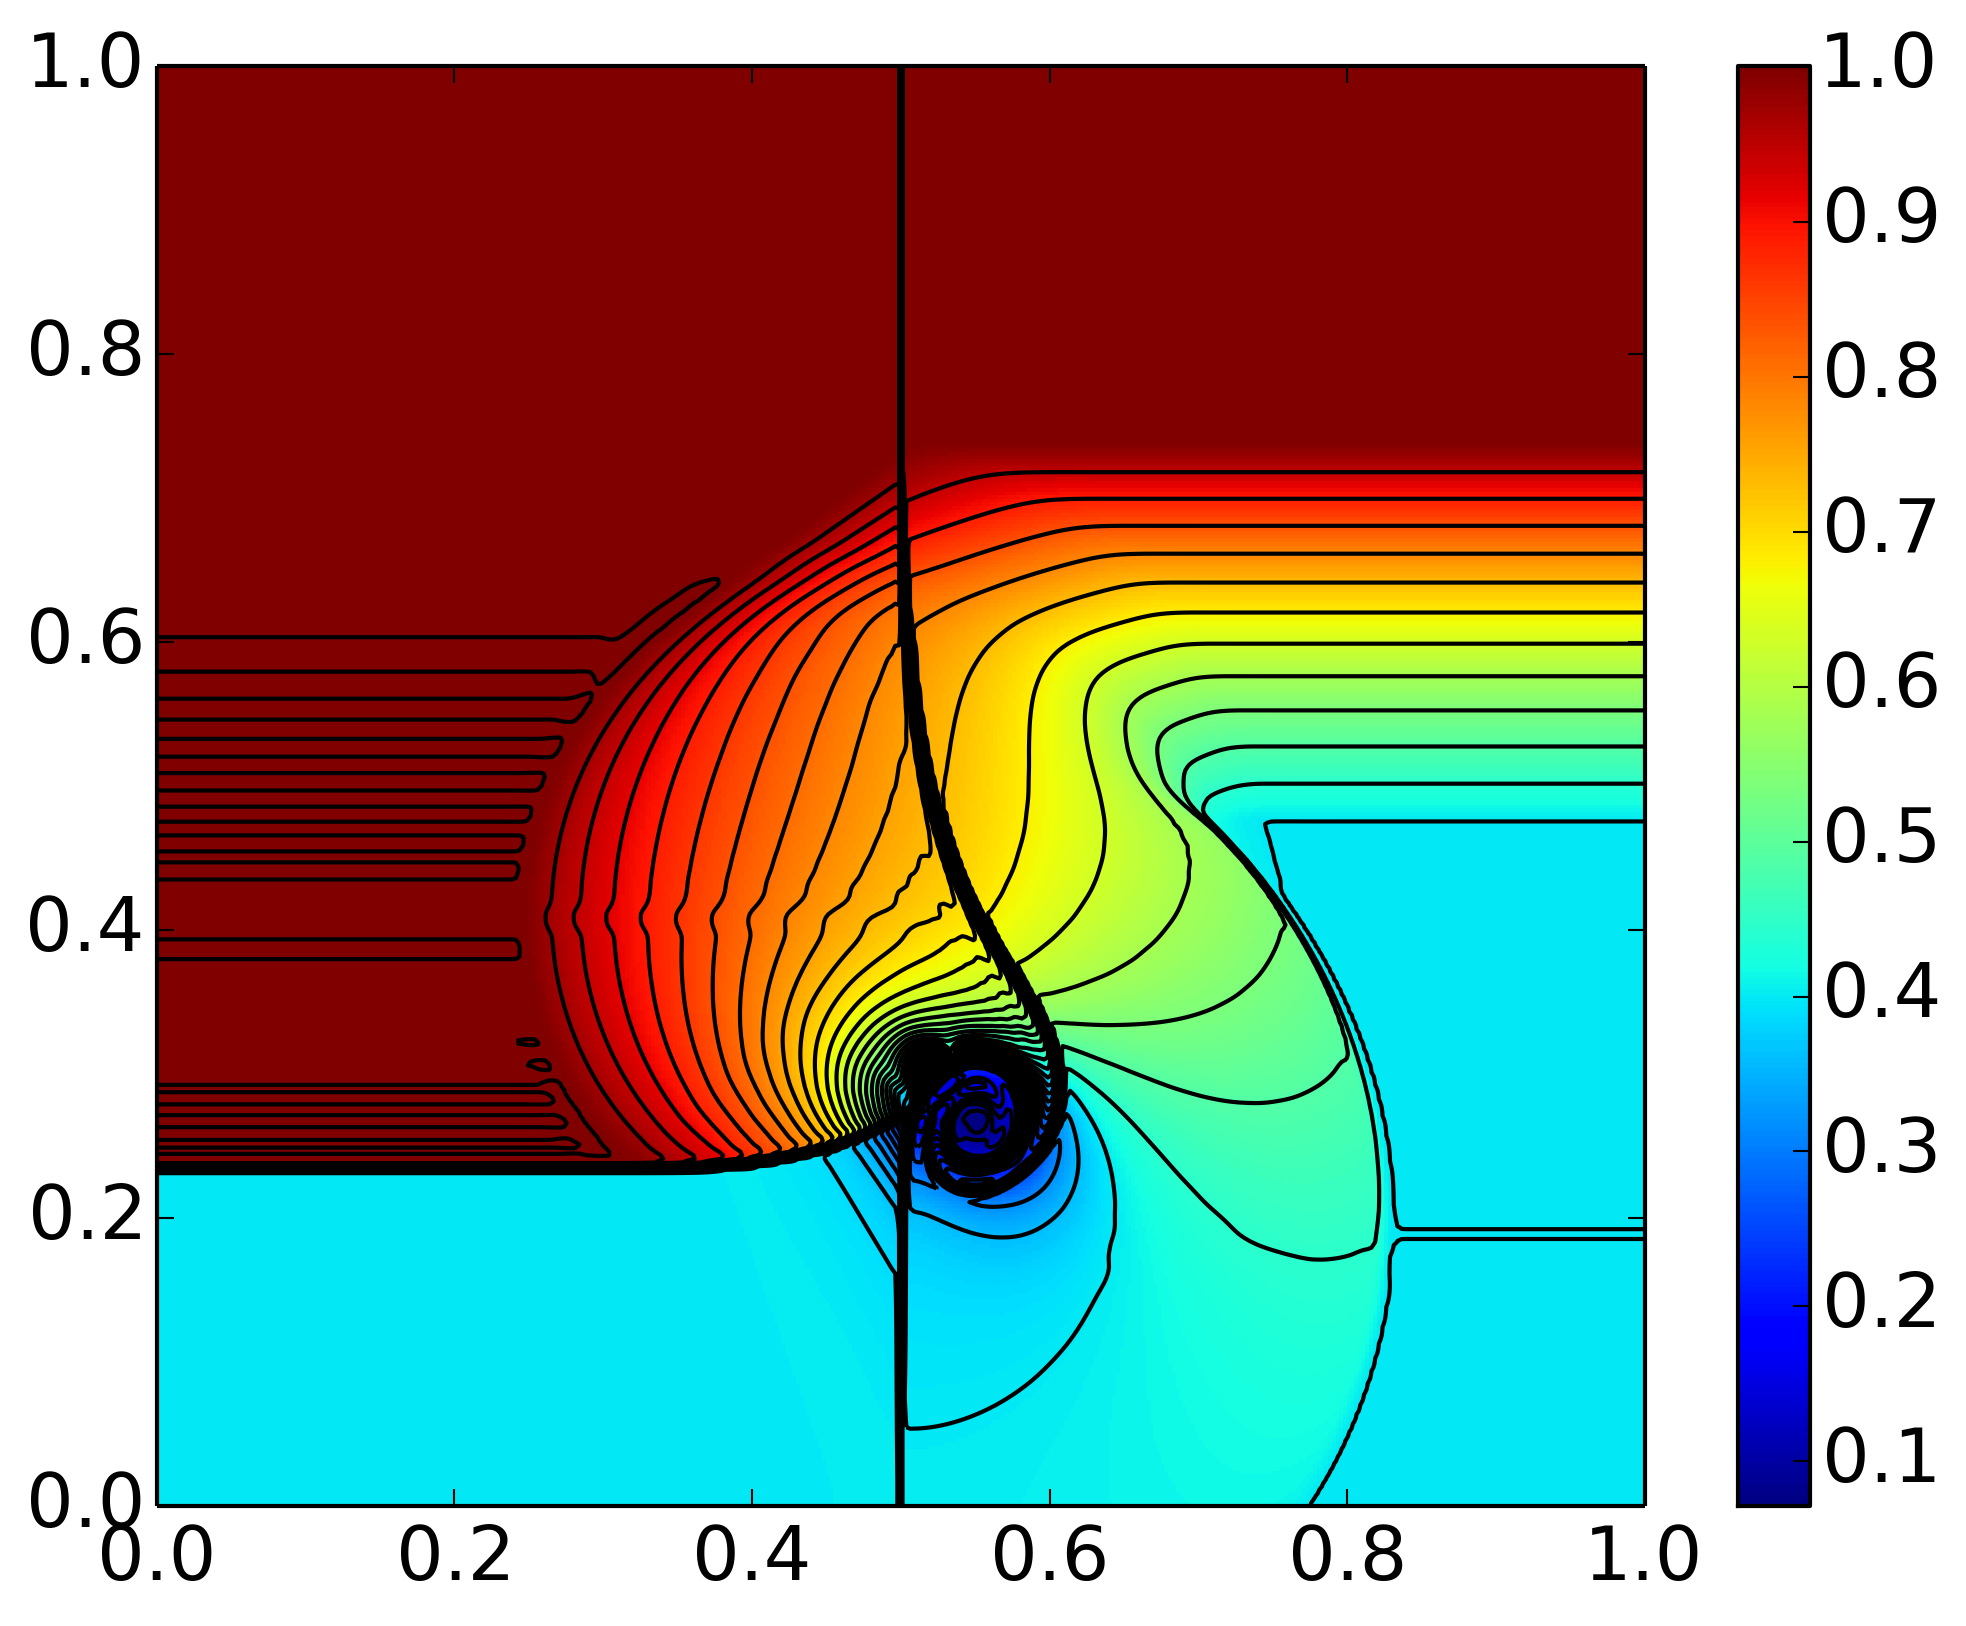
Results of 2D Riemann problem from Case 17. Pressure is displayed in color and density contours are superimposed. For detail see [s399].
Noh Problem
This problem is simulated on a domain \((x,y)\in [0,1]\times[0,1]\), with the initial density set to 1, and pressure set to zero (\(1\times 10^{-6}\) to avoid numerical problems). The initial velocity is directed at the origin and is constant with magnitude 1. The solution is an infinite strength circularly symmetric shock reflecting from the origin. Behind the shock (inside the circle) the density is 16, the velocity is 0 and the pressure is 16/3. The shock speed is \(1/3\), and ahead of the shock, the density is \(1+t/\sqrt{x^2+y^2}\), while velocity and pressure remain as set initially. The problem is simulated by using wall boundary conditions on the left and bottom boundaries, while on the top and right boundaries the exact solution is enforced. The simulation is run to \(t=2\), on two grids, \(200\times 200\) and \(400\times 400\).
This is a very difficult problem, and one of those rare cases in Gkeyll in which almost every step is rejected (due to negative pressure) and retaken with Lax fluxes. Note that according to [Liska2003] many schemes fail on this problem, and even those that work show numerical artifact. As shown below, Gkeyll does a fairly good job of capturing the physics, on par with the best schemes shown in [Liska2003].
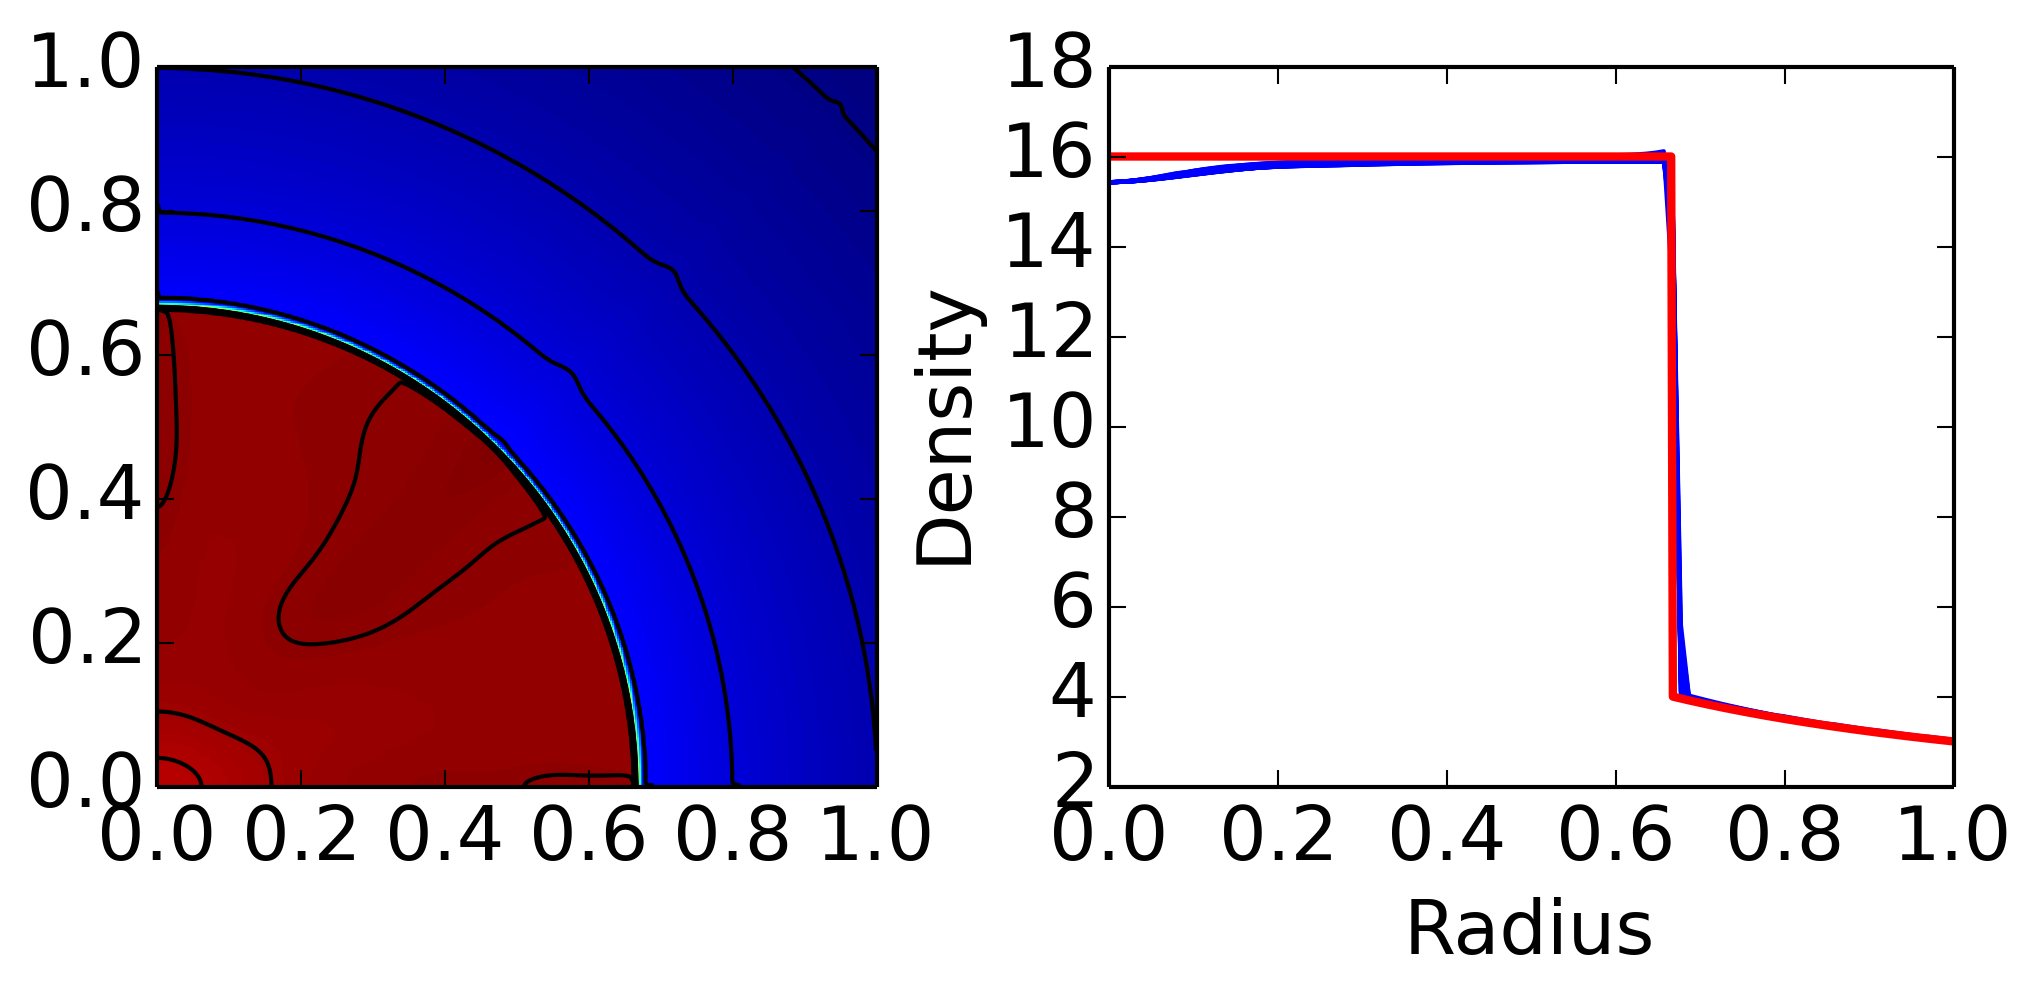
Left panel shows color plot of density, with superimposed density contours (from 2.5 to 4.0 in step of 0..25, and 14.0 to 17.0 in step of 0.2) for Noh problem on a \(400\times 400\) grid. See [s401]. The right panel shows lineouts of the density (blue lines) along several radial lines drawn from the origin. Solid red line is the exact solution. Gkeyll is robustly able to handle this difficult problem, with only a small (incorrect) dip in the density close to the origin.
Rayleigh-Taylor instability
For this problem, a heavier fluid (with density 2) is placed on top of a lighter fluid (with density 1). Gravitational acceleration \(g=0.1\) acts in the downward direction. The interface between the fluids is \(y=1/2 + 0.01\cos(6\pi x)\), i.e. a slightly perturbed line around \(y=1/2\). The domain is \((x,y)\in[0,1/6]\times[0,1]\), and the simulation is run on a \(100\times 400\) grid to \(t=8.5\). The initial pressure is in hydrostatic equilibrium. [Liska2003] states that “Around the interface the initial conditions are smoothed out.” This has not been done here.
This configuration is highly unstable, and typical “mushroom head” structures form rapidly, with the interface between the heavy and light fluid breaking up. Gkeyll results compare very well with results published in [Liska2003]. Note that I have displayed the results differently, with the mushroom in the center of the domain.
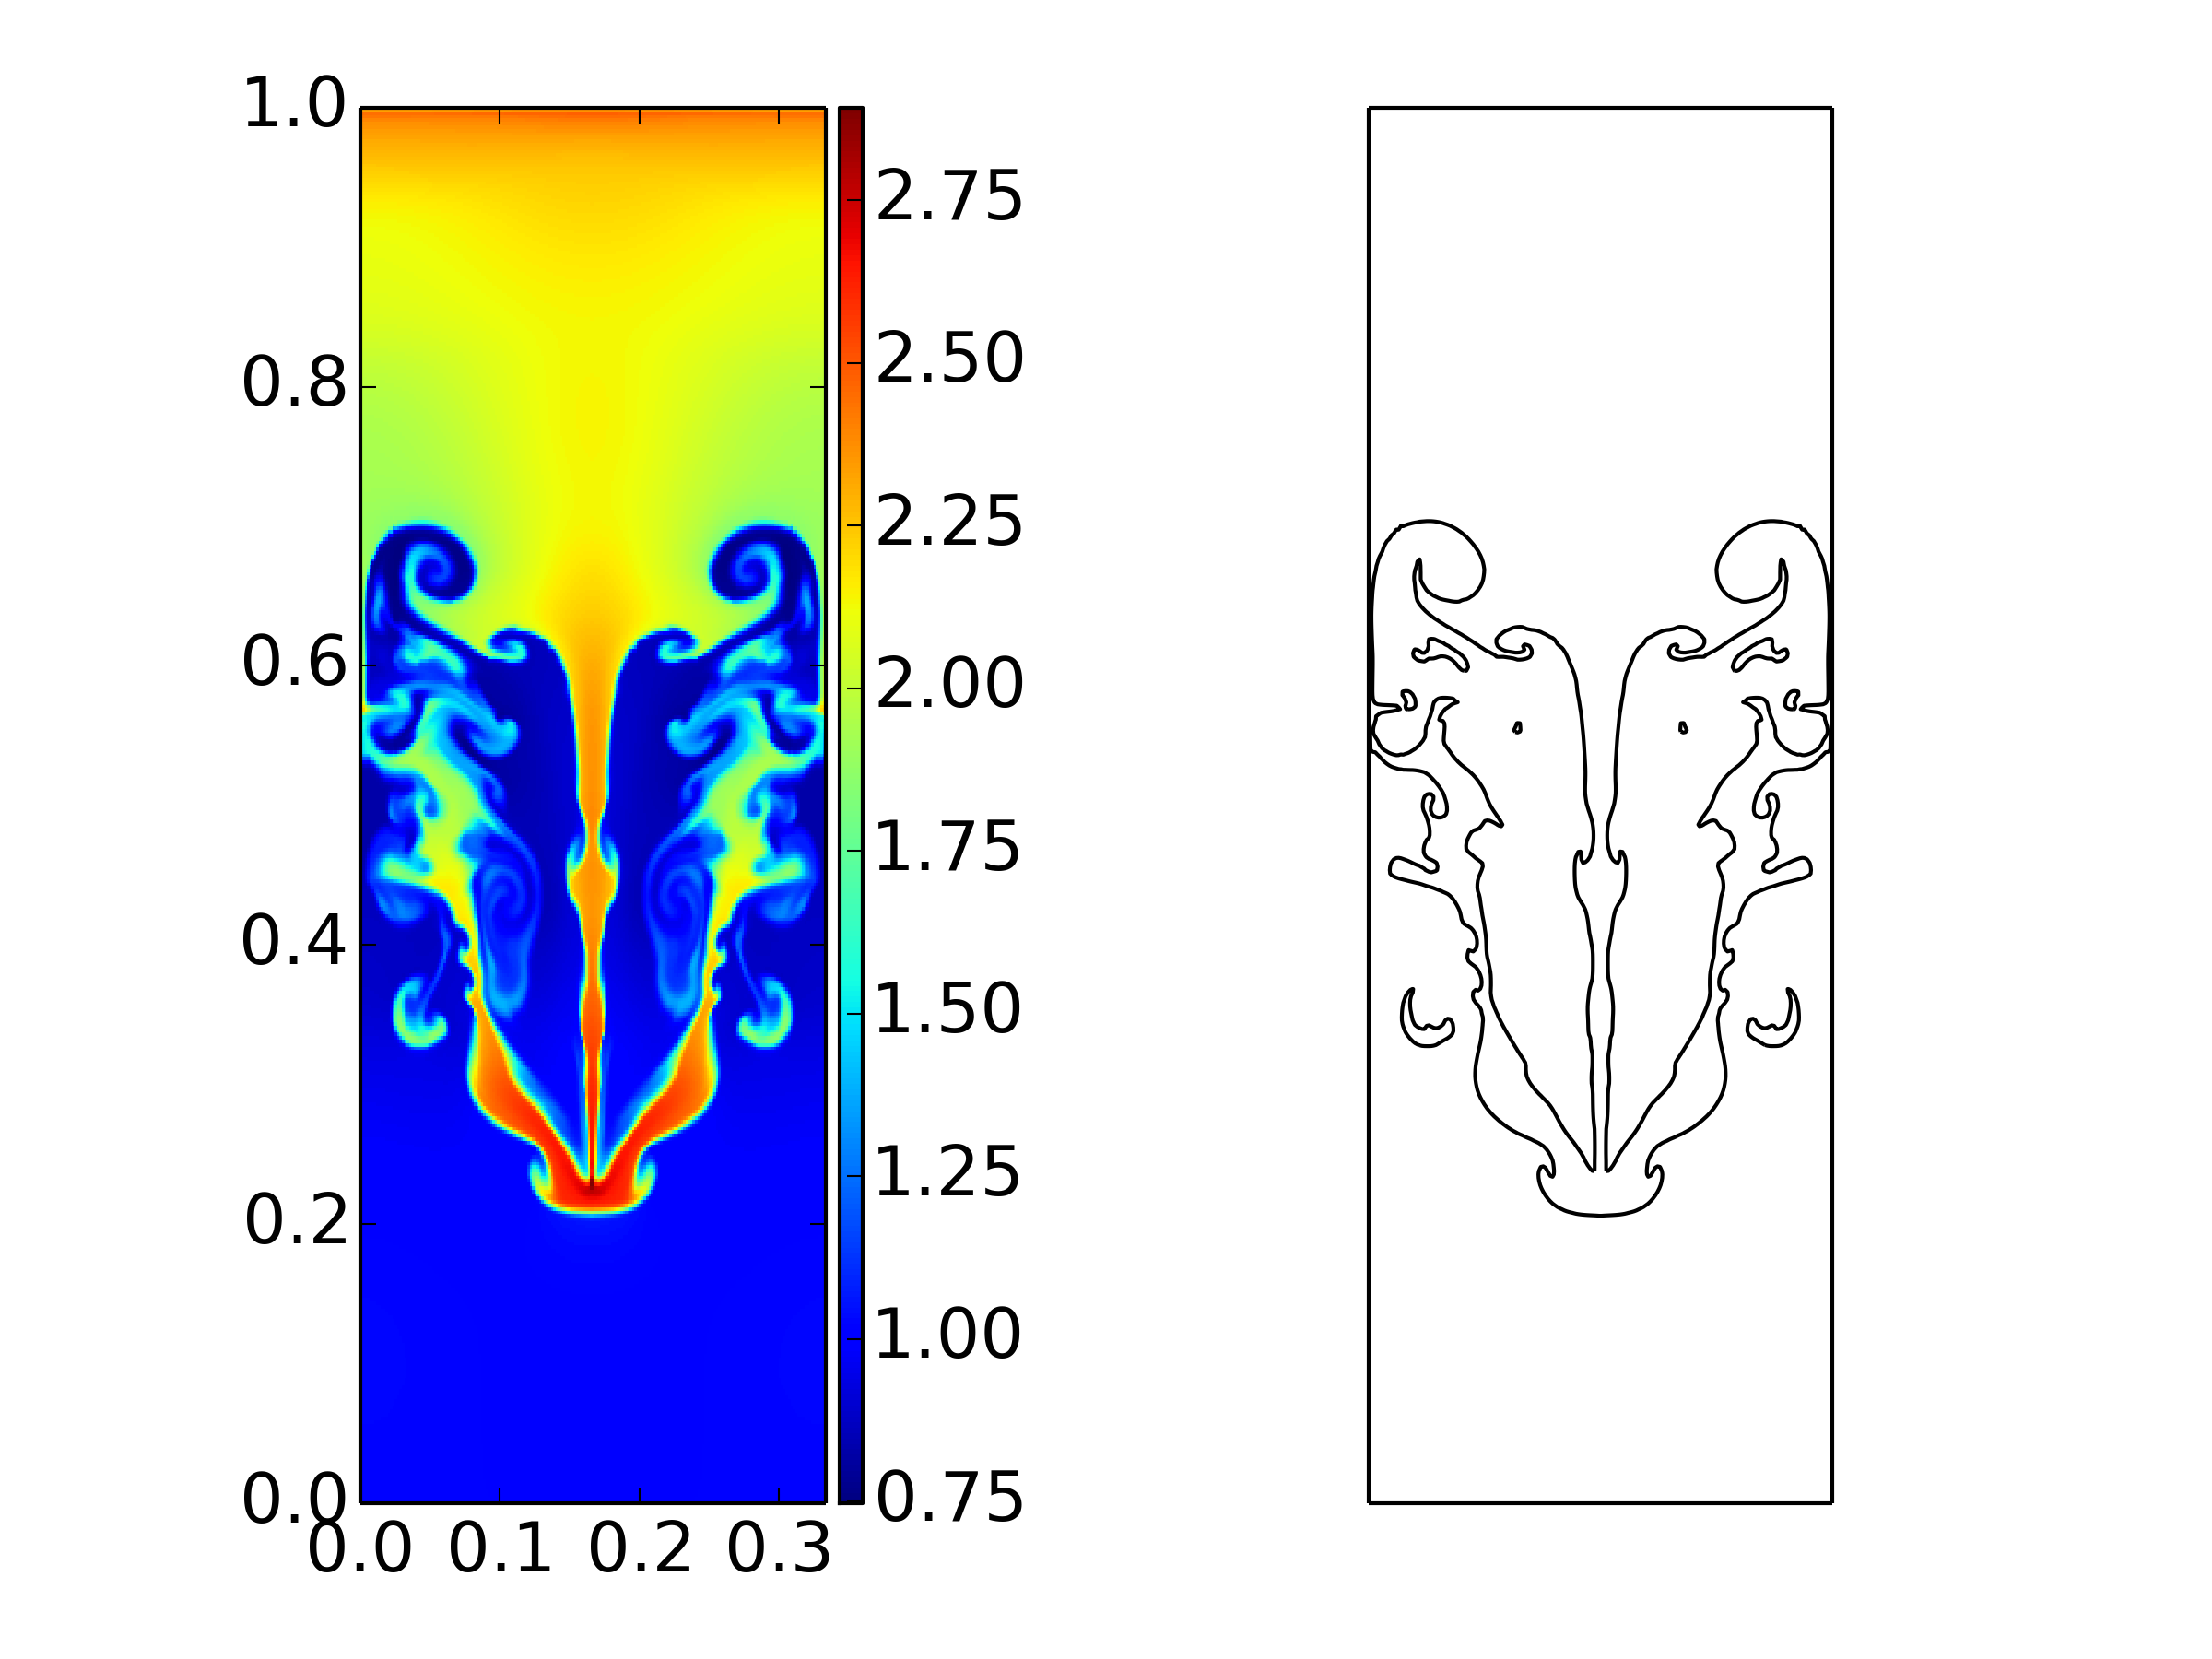
Left panel shows color plot of density and right panel shows the \(\rho=1.5\) contour, displaying the interface between the fluids. The simulation is only performed on the left of the domain, and results reflected about \(x=1/6\) for plotting. See [s402] for details.
Implosion problem
In this problem, a gas is placed inside a smaller square, placed inside a bigger square. The smaller square is centered about the origin, but rotated by \(\pi/4\). The size of the domain is \((x,y)\in (-0.3,0.3)\times (-0.3,0.3)\), with the smaller box with corners at \((0.15,0)\) and \((0.0,0.15)\). Inside the smaller box, we have \(\rho=0.125\) and \(p=0.14\), while outside \(\rho=1.0\) and \(p=1.0\). The problem is simulated only in the upper right quadrant on a \(400\times 400\) grid, with wall boundaries on all four sides.
In the figure below, the pressure and density early in time are shown. This compares very well with Figure 4.6 of [Liska2003]. Notice the small asymmetries, which eventually grow, specially around the origin late in time.
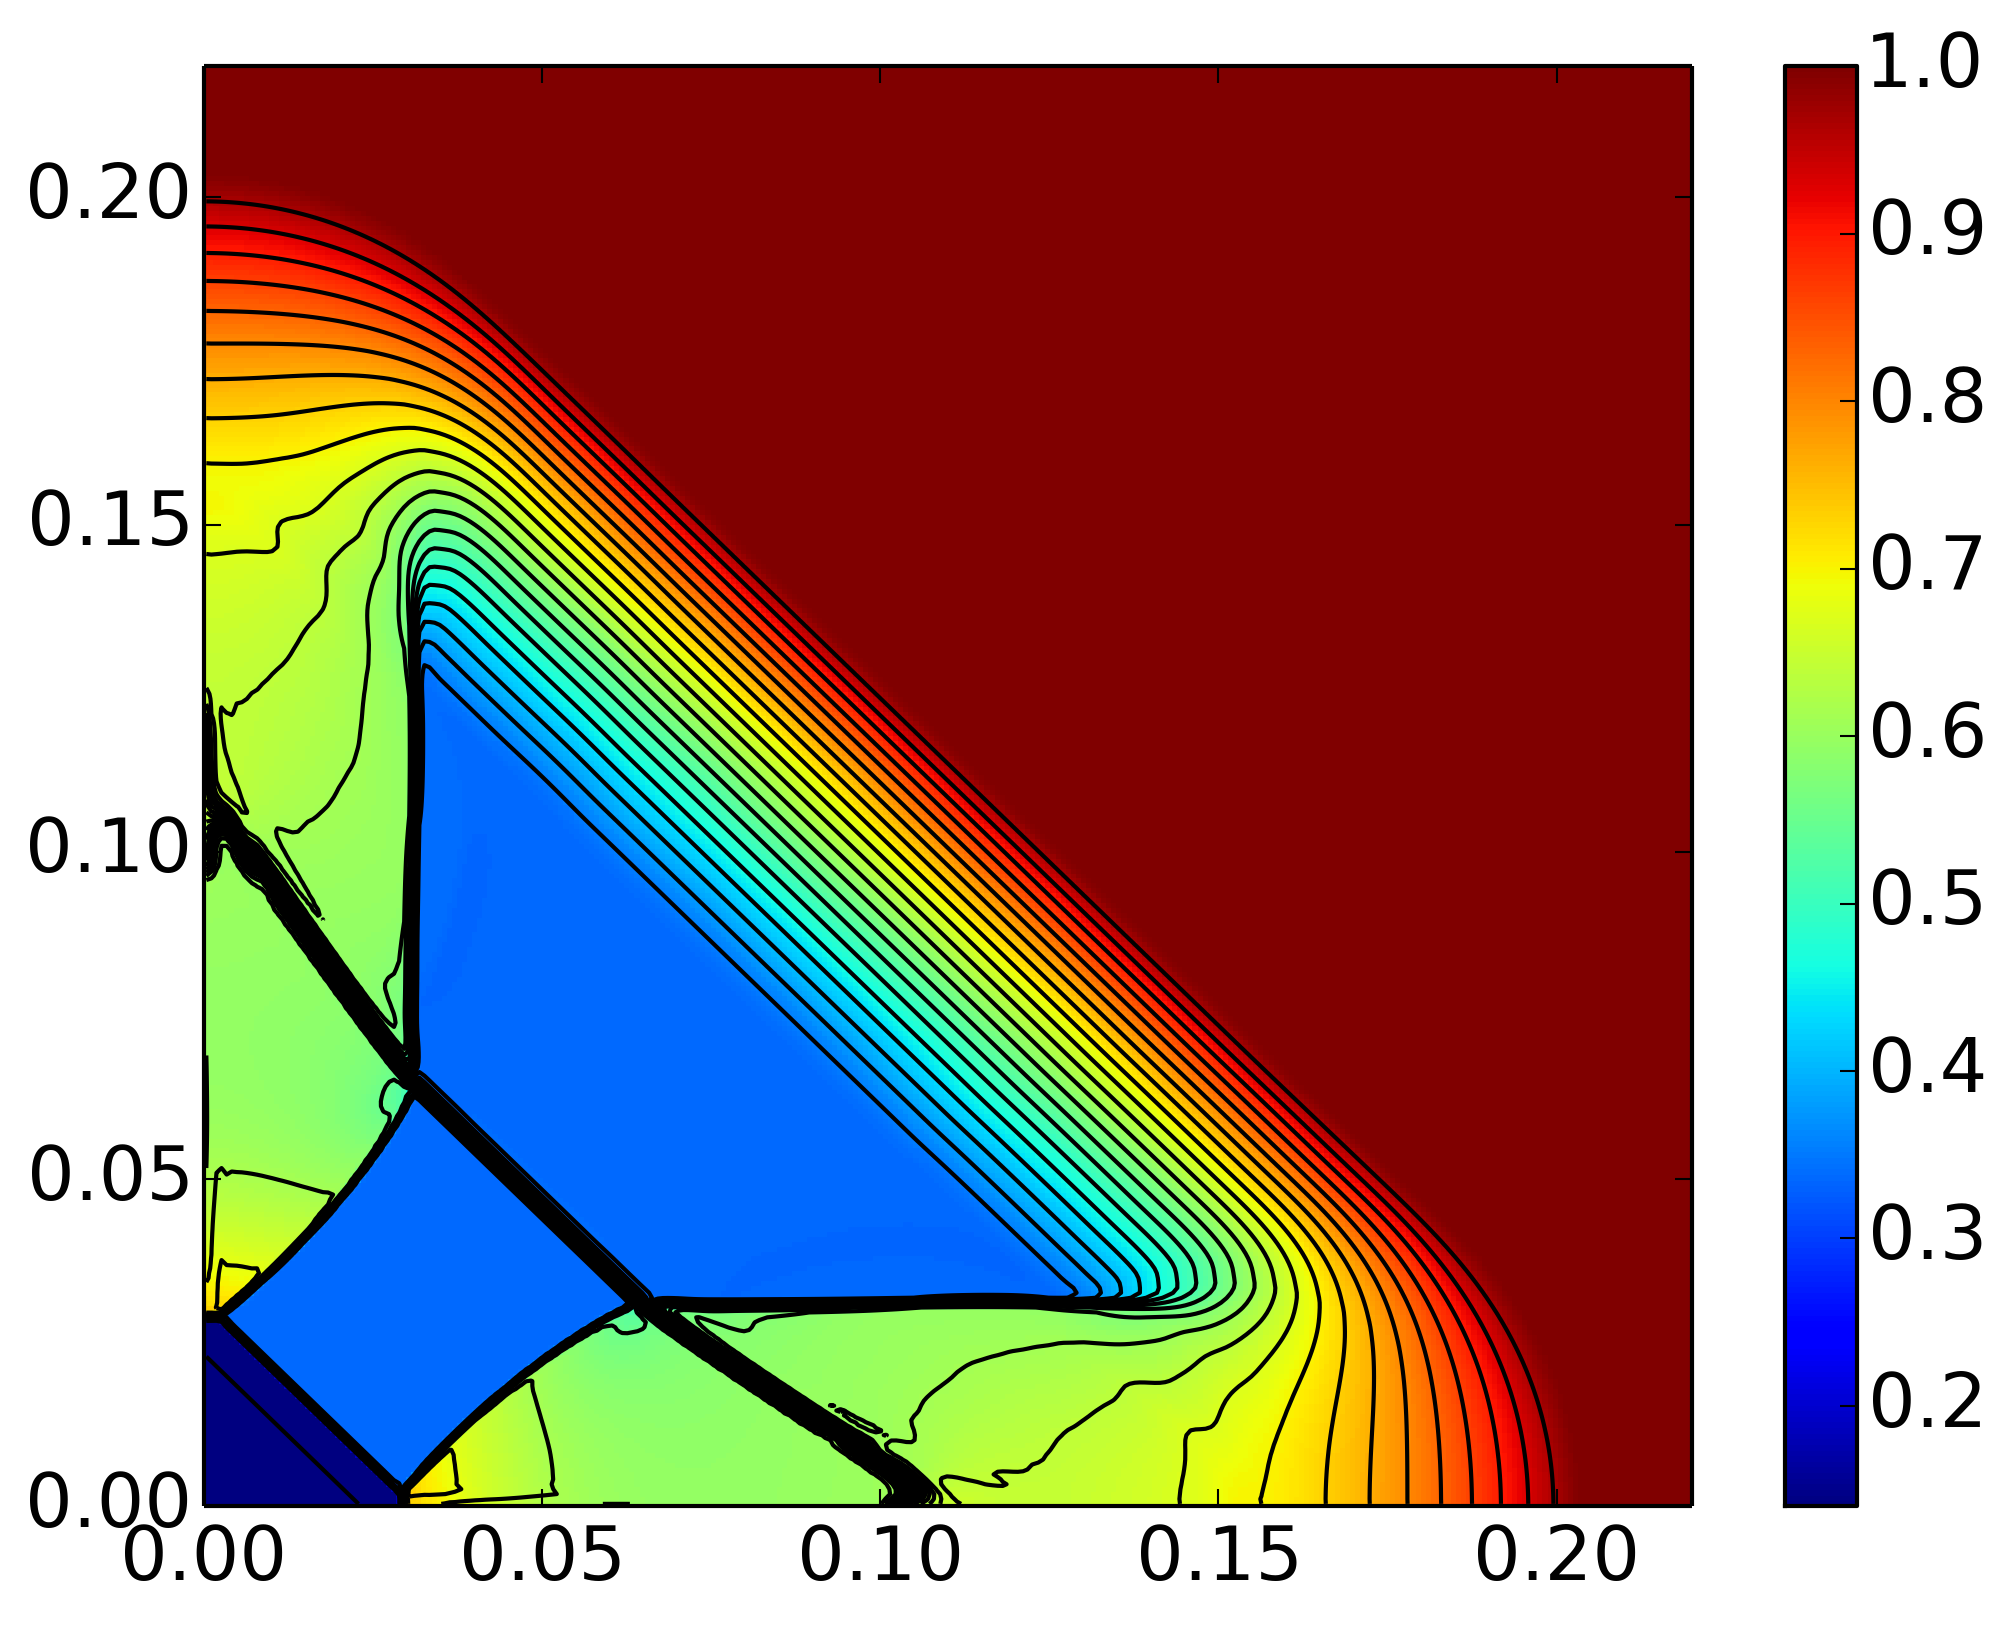
Pressure from implosion problem [s404], with density contours superimposed (36 contours from 0.125 to 1). The plot shows the inner \((0,0.22)\times(0,0.22)\) box of the larger \((0,0.3)\times(0,0.32)\). The results compare very well with [Liska2003], however, even at this early stage some asymmetries (about the \(x=y\) line) are visible.
The figure below shows the solution late at in time (\(t=2.5\)). Note the complex flow pattern. Also, there are significant asymmetries, specially close to the origin. These asymmetries are probably due to the dimensional splitting. In particular, note that the “jet” in the WENO5 and CLAW schemes in Figure 4.7 of [Liska2003] has bent downwards.
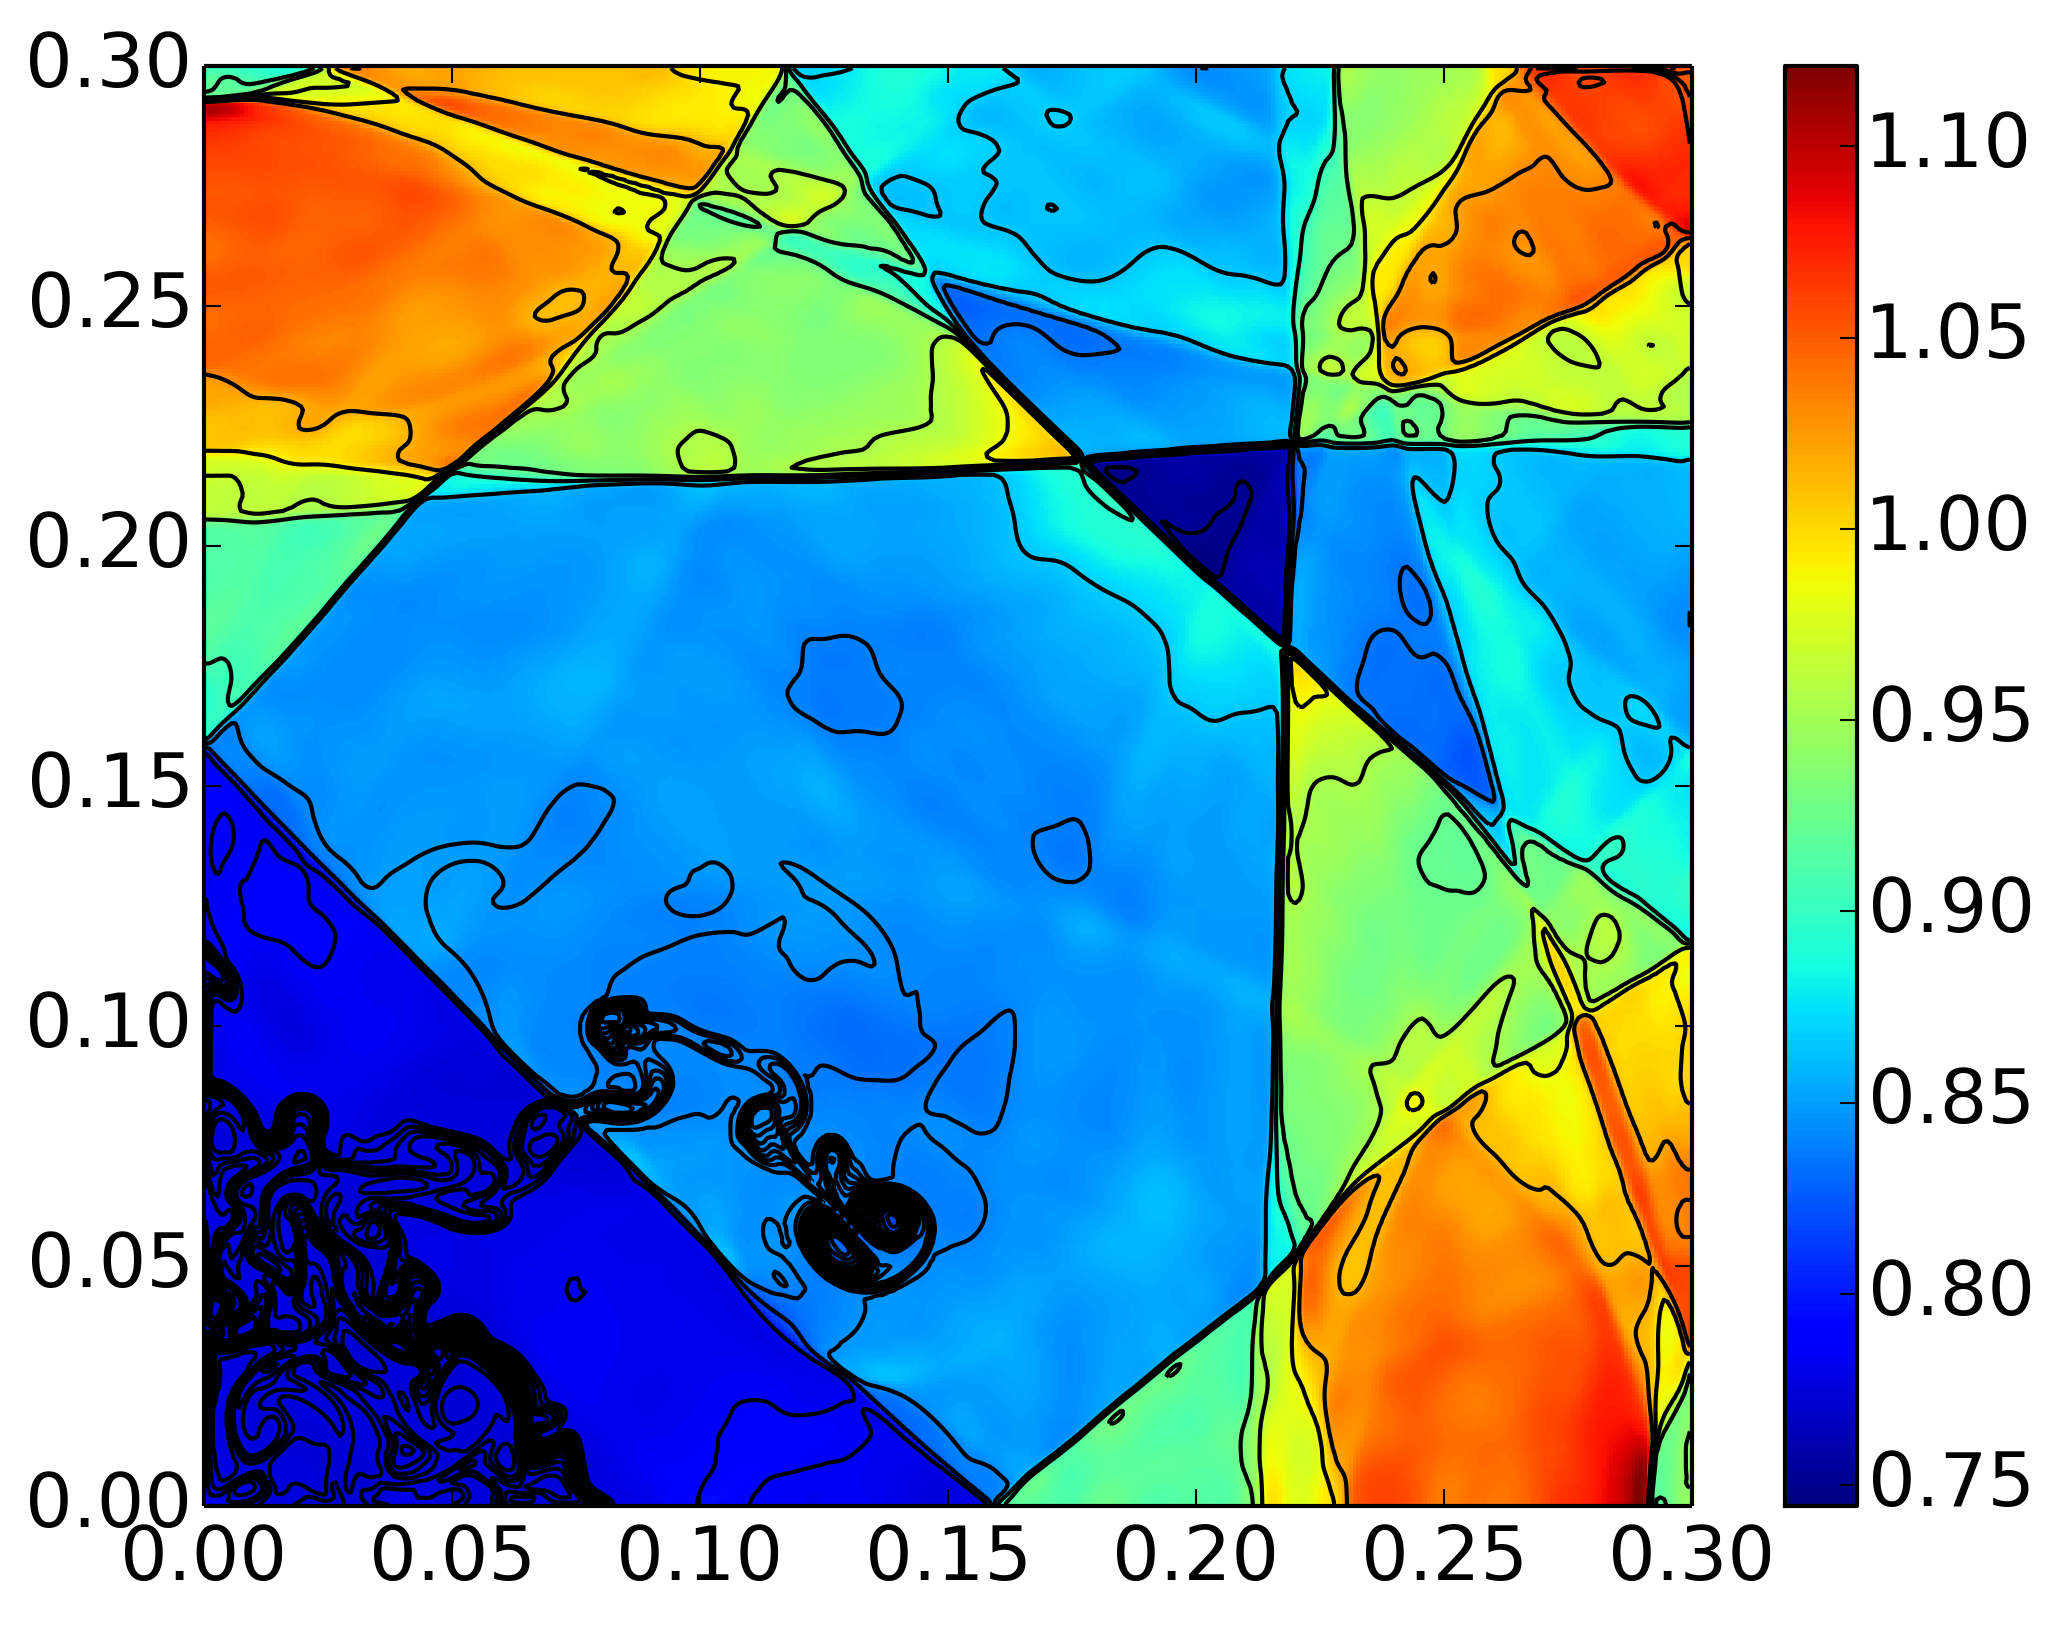
Pressure from implosion problem [s405], with density contours superimposed (31 contours from 0.35 to 1). Note the asymmetries about the \(x=y\) line, specially close to the origin. The mushroom cloud like jet, which should be directed diagonally, has bent downwards. This asymmetry is likely due to two causes: dimensional splitting, and initial conditions.
In an effort to understand the cause of these asymmetries, I implemented a scheme in which the XY in one time step is followed by a YX update in the next time-step. This did have a small effect, however, the asymmetries are still visible. I also smoothed the interface between the gases, and although this does change the result slightly, it does not remove the asymmetries. The jet flow is highly unstable as it is buffeted from waves reflecting from the walls, making the flow sensitive to the discretization details.
Explosion problem
In this problem a bubble of high density and pressure (\(\rho_i=1.0\), \(p=1.0\) and radius \(0.4\)) is placed in a background gas with density \(\rho_0 = 0.125\) and pressure \(p_0 = 0.1\). The explosion sets up an inward shock and two contact waves. One of the contact surfaces is highly unstable and breaks up into a complex set of vortices. See figure below, which compares well with the solution presented in [Liska2003] with the PPM method. Note that the interface was smoothed by using a 3-point (in each direction) Gaussian quadrature while initializing the simulation.
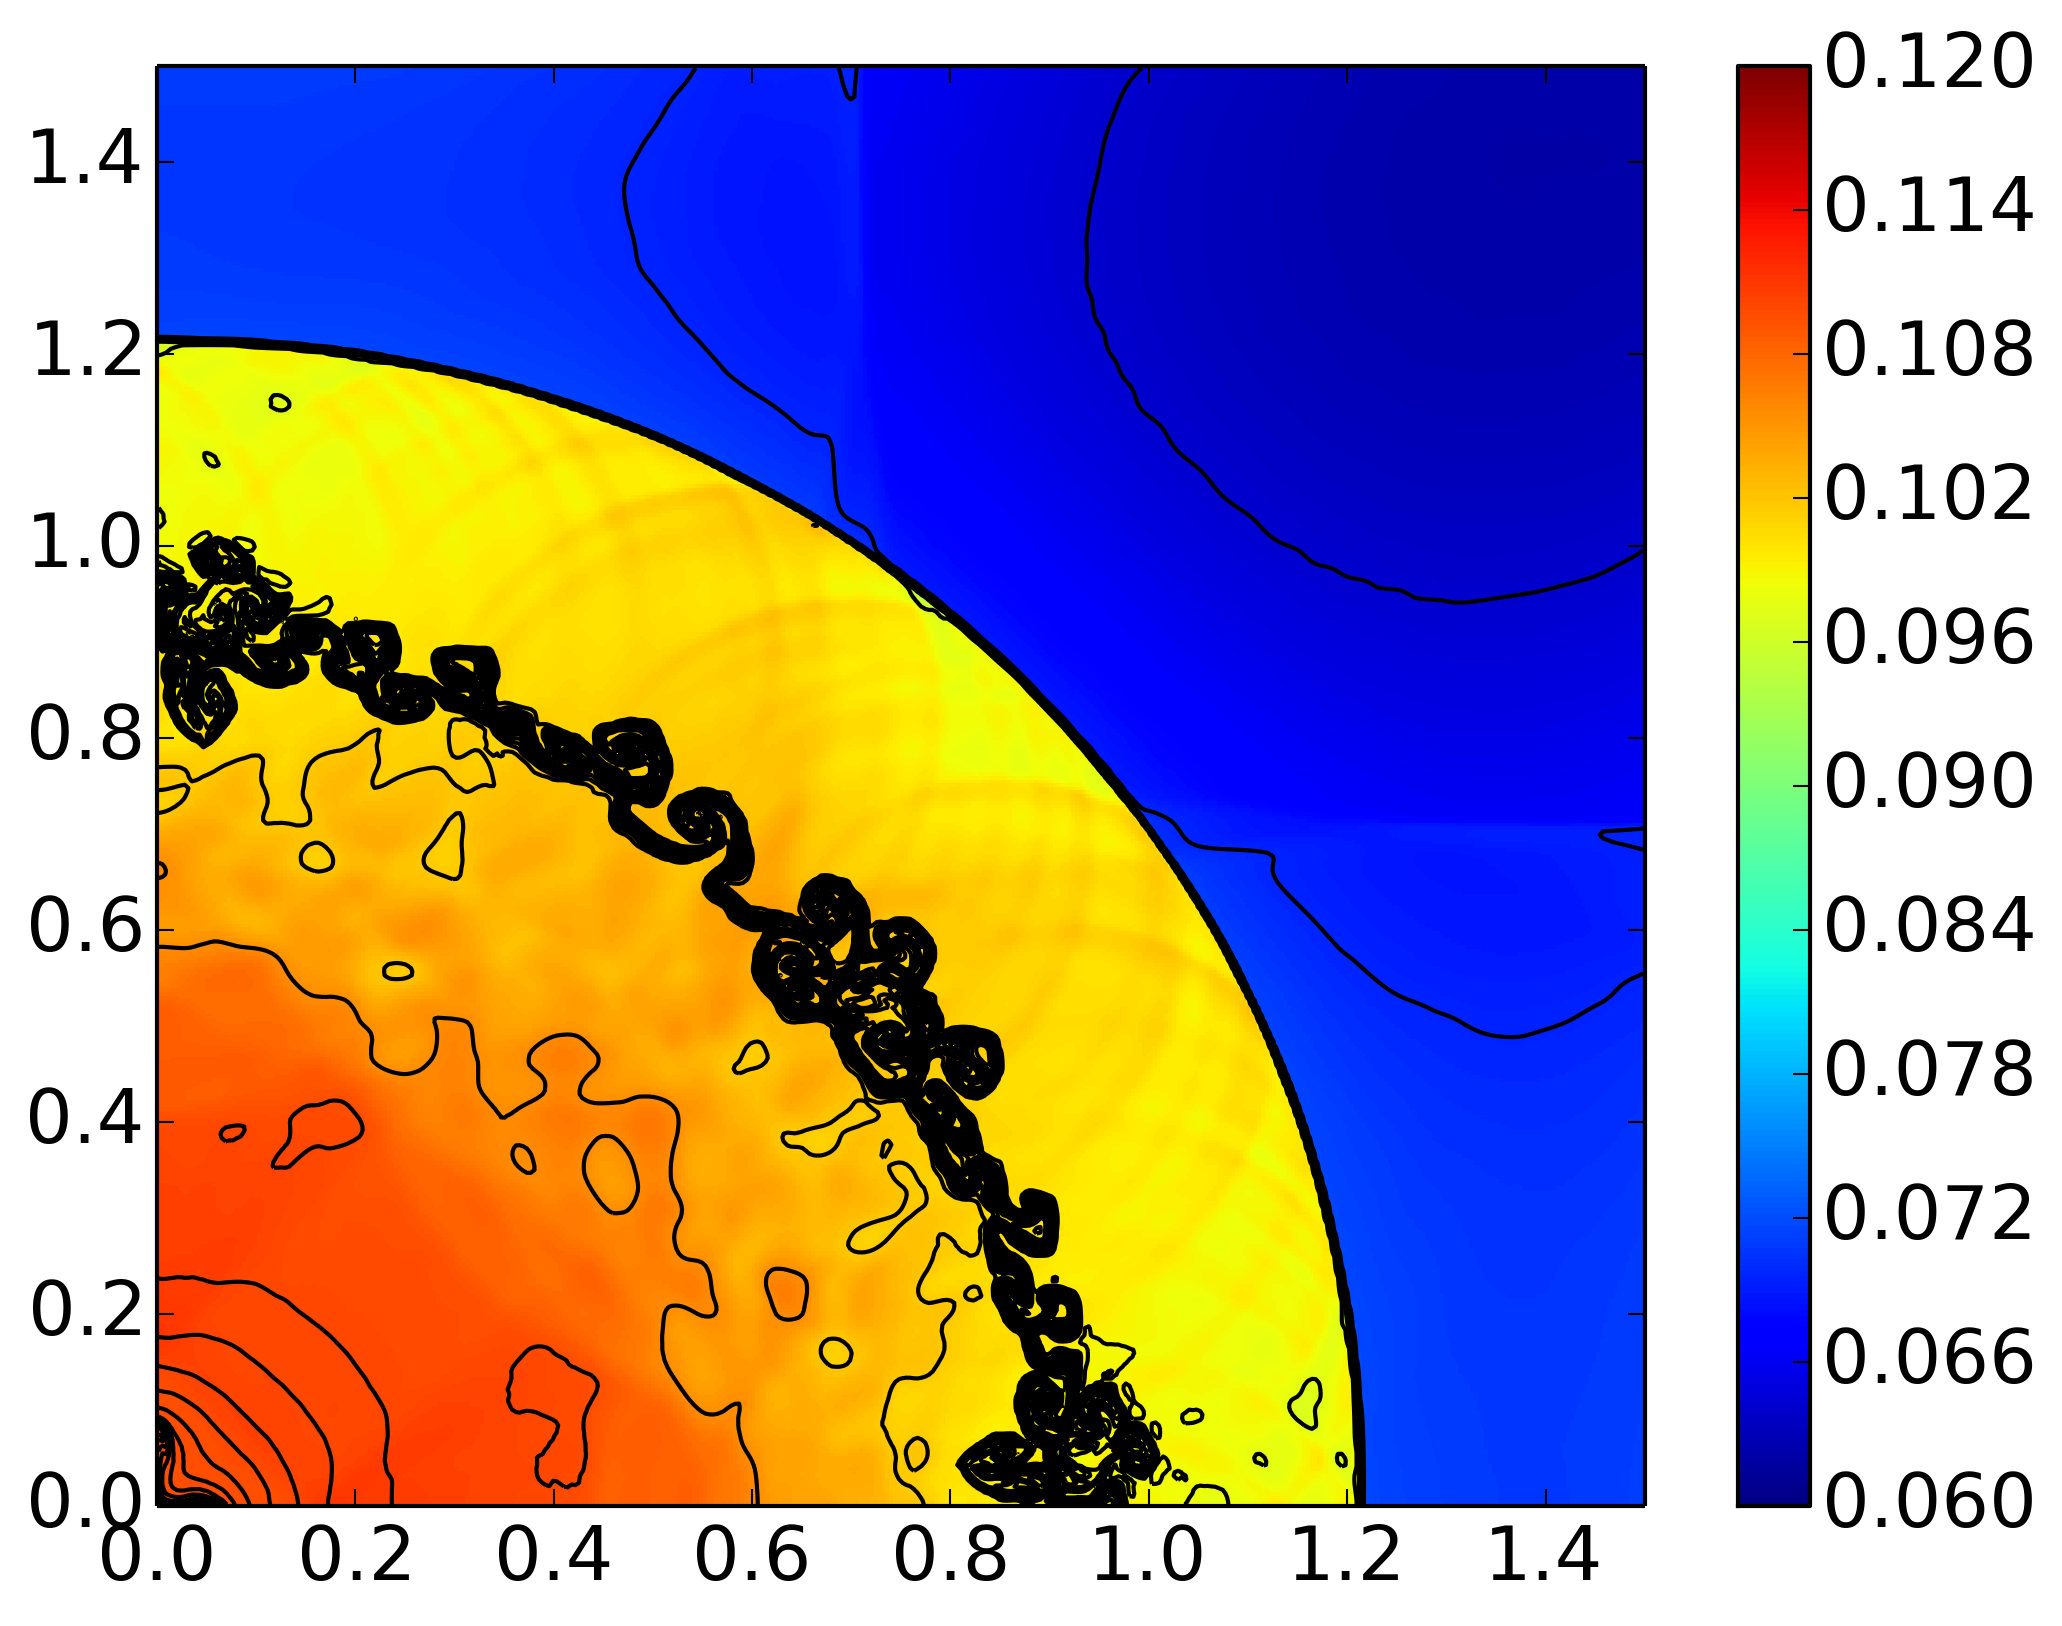
Pressure from explosion problem [s407], with density contours superimposed (27 contours from 0.08 to 0.21). The results compare well with those obtained by the PPM scheme, and presented in [Liska2003].
Conclusions
Through a comprehensive series of tests, I have shown that the 2D Euler solver in Gkeyll (in particular the WavePropagationUpdater) works well. The issue of asymmetries in the implosion problem is not completely resolved, however, initial results show that an unsplit scheme (with transverse correction to allow a larger stable time-step), and more careful initial condition, may fix this.
I should also point out that [Liska2003] (and others) seem not aware of the simple trick to fixing positivity violations in FV schemes. In fact, every problem that fails in [Liska2003] can be successful simulated by just switching to Lax fluxes and first-order for a small number of problematic steps. In this regard, Gkeyll algorithms are very robust, working even when some other algorithms fail.
References
Randall J. LeVeque, Finite Volume Methods For Hyperbolic Problems, Cambridge University Press, 2002.
